Figure 5.
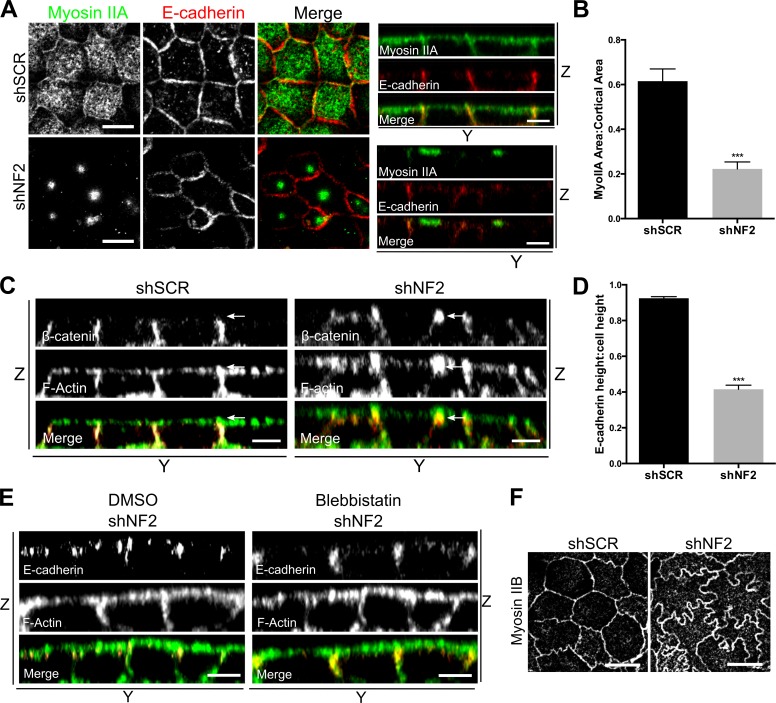
Features of apical contraction in Merlin-deficient cells. (A) Confocal images showing the cortical distribution of MyoIIA (green) and E-cadherin (red) in control (shSCR) and shNF2-expressing Caco2 monolayers. Bars, 10μm. The distributions of E-cadherin and F-actin along the z axis are shown in accompanying y-z views (apical = top). Bars, 5μm. (B) The cortical area covered by MyoIIA was quantified by calculating the ratio of cortical MyoIIA to the total cortical area delimited by F-actin. n = 25 cells per group. (C) Y-Z confocal images of control and shNF2-expressing Caco2 cells showing the vertical height and apical position of the ZA marked by β-catenin and F-actin. Arrows indicate the apical junction region. Bars, 5μm. (D) Ratio of E-cadherin–marked cell junction height to total cell height in control and shNF2-expressing Caco2 cells. n = 10 cells per group. (E) Y-Z confocal images depicting the vertical height and position of the E-cadherin and F-actin–stained ZA in shNF2-expressing Caco2 cells treated with either 100-µM blebbistatin or DMSO. Bars, 5μm. (F) Confocal images showing the distribution of Myosin IIB in control and shNF2-expressing Caco2 cells. Bars, 10μm. Error bars indicate SEM. ***, P < 0.001. Data are representative of at least three experiments.

