Figure 7.
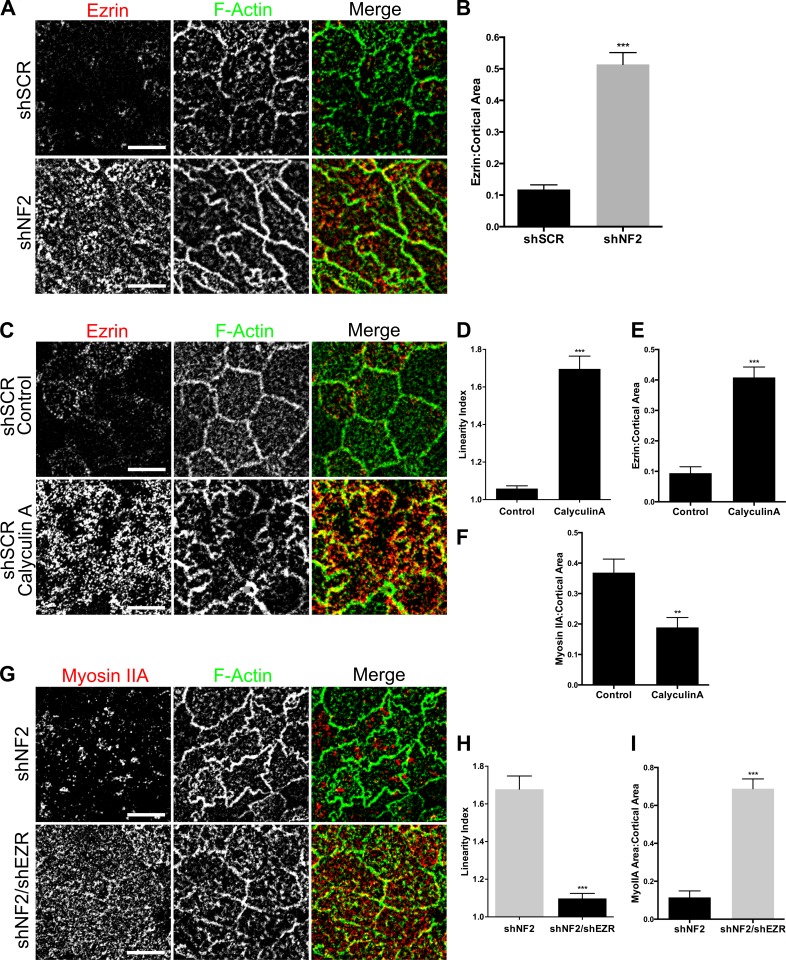
Increased cortical Ezrin drives apical contractility. (A) Endogenous Ezrin (red) and junctional F-actin (green) in confluent control and shNF2-expressing Caco2 cells as depicted by representative confocal images. (B) The levels of apical Ezrin in A were quantified by calculating the ratio of apical Ezrin to the total apical area delimited by F-actin. (C) Confocal images showing apical Ezrin and junctional F-actin in shSCR Caco2 cells treated with DMSO or 1-µM calyculin A for 5 min. (D) Linearity index of F-actin–labeled junctions calculated from the experiment in C. (E) Levels of apical Ezrin in control or calyculin A–treated cells. (F) Levels of cortical MyoIIA in control or calyculin A–treated cells. (G) Confocal images depict the levels and distribution of MyoIIA (red) and F-actin (green) in shNF2- and shNF2/shEZR-expressing Caco2 cells. (H) Linearity index in shNF2- and shNF2/shEZR-expressing cells. (I) Cortical area covered by MyoIIA in shNF2- and shNF2/shEZR-expressing cells. Error bars indicate SEM. **, P < 0.01; ***, P < 0.001. Data are representative of at least two experiments. Bars, 10 µm.

