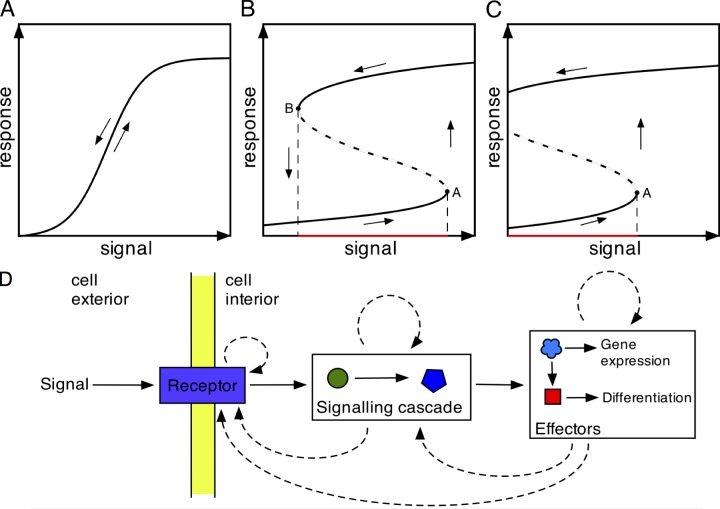
Figure 1.
Models for biological signal responses. (A–C) Schematic signal-response curves for cellular differentiation. Signal responses for cell differentiation can reflect an ultrasensitive, reversible response (A), a bistable reversible response (B), or an irreversible bistable response (C). The dashed lines represent unstable intermediates between the response profiles, with ascending and descending levels of signal. (D) Once a differentiation signal is received, the response can be stabilized using positive feedback loops operating at different levels in the signal-response pathway, generating bistability in the system. The solid arrows represent progression from signal reception to signal transduction (two components are shown) and thereafter to effector molecules that drive changes in gene expression and differentiation state. Dotted arrows represent possible sites of positive feedback driving the signal response.

