Figure 6.
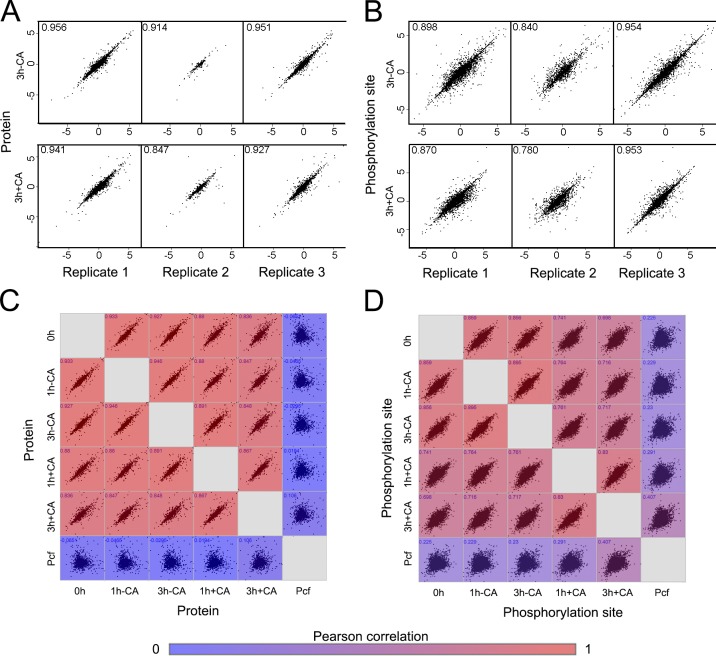
Summary of the changes in the phosphoproteome at each time point under each experimental regimen. (A) The protein SILAC H/L ratio of the individual biological replicates compared pairwise to the mean ratio (with Pearson correlation), after 3 h in the absence of CA (3 h − CA, top panel) or 3 h in the presence of CA (3 h + CA, bottom panel). (B) Pairwise comparison of phosphorylation site data, presented as described for A. (C) Pairwise comparison of the mean protein SILAC H/L ratio determined under each experimental regimen: 0 h – stumpy, t = 0 h; 1 h − CA, t = 1 h no CA; 3 h − CA, t = 3 h no CA; 1 h + CA, t = 1 h with CA; and 3 h + CA, t = 3 h with CA. The matrix is colored according to the Pearson correlation between each pair. (D) Pairwise comparison of phosphorylation site data under each experimental regimen, presented as described for C. Pcf, cultured procylic form cell.

