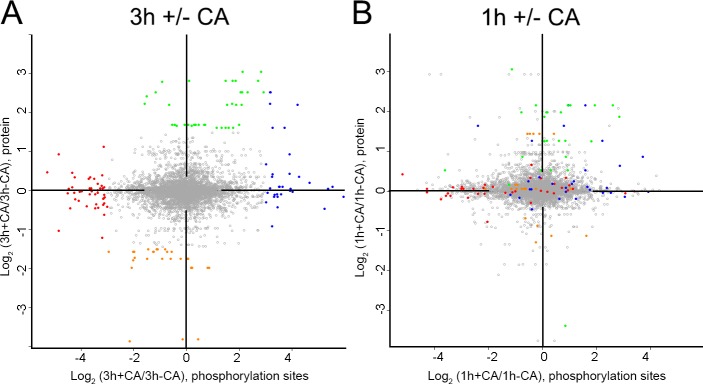
Figure 7.

Distinct changes occur in the proteome before and after commitment. (A and B) Changes in protein and phosphorylation site abundance in cells treated with CA compared with untreated cells at time points after commitment (3 h; A) and before commitment (1 h; B). Coloring represents the greatest changes that occur at 3 h, defined as follows: blue, phosphorylation site up at 3 h + CA (log2 [3 h + CA/3 h − CCA], phosphorylation site ≥3.0); red, phosphorylation sites down 3 h + CA (log2 [3 h + CA/3 h − CCA], phosphorylation site less than −3.0); green, proteins up 3 h + CA (log2 [3 h + CA/3 h − CCA], protein ≥1.5); and orange, proteins down 3 h + CA (log2 [3 h + CA/3 h − CCA], protein less than −1.5).
