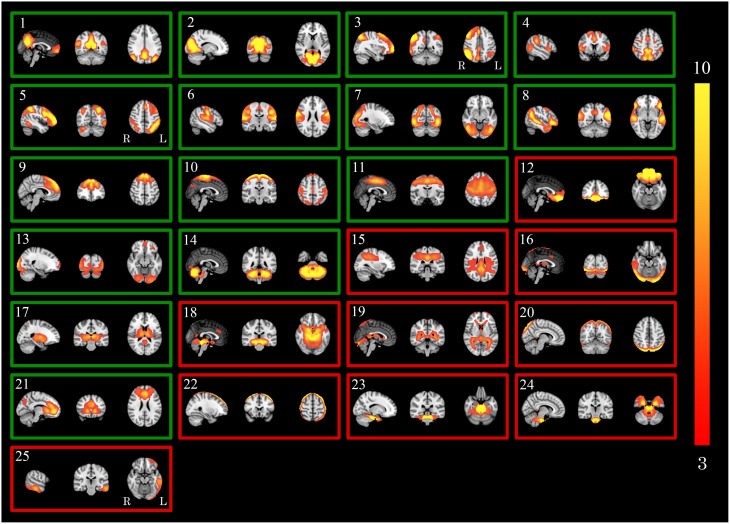
Figure 2.
GICA spatial maps for statistical analysis. Maps illustrate the 25 GICA networks' most informative orthogonal slices of data before and after applying FIX combined (GICA-3). Green frames indicate RSNs; red frames indicate noise networks. Color bar represents Z-scores. GICA, Group-level Independent Component Analysis.

