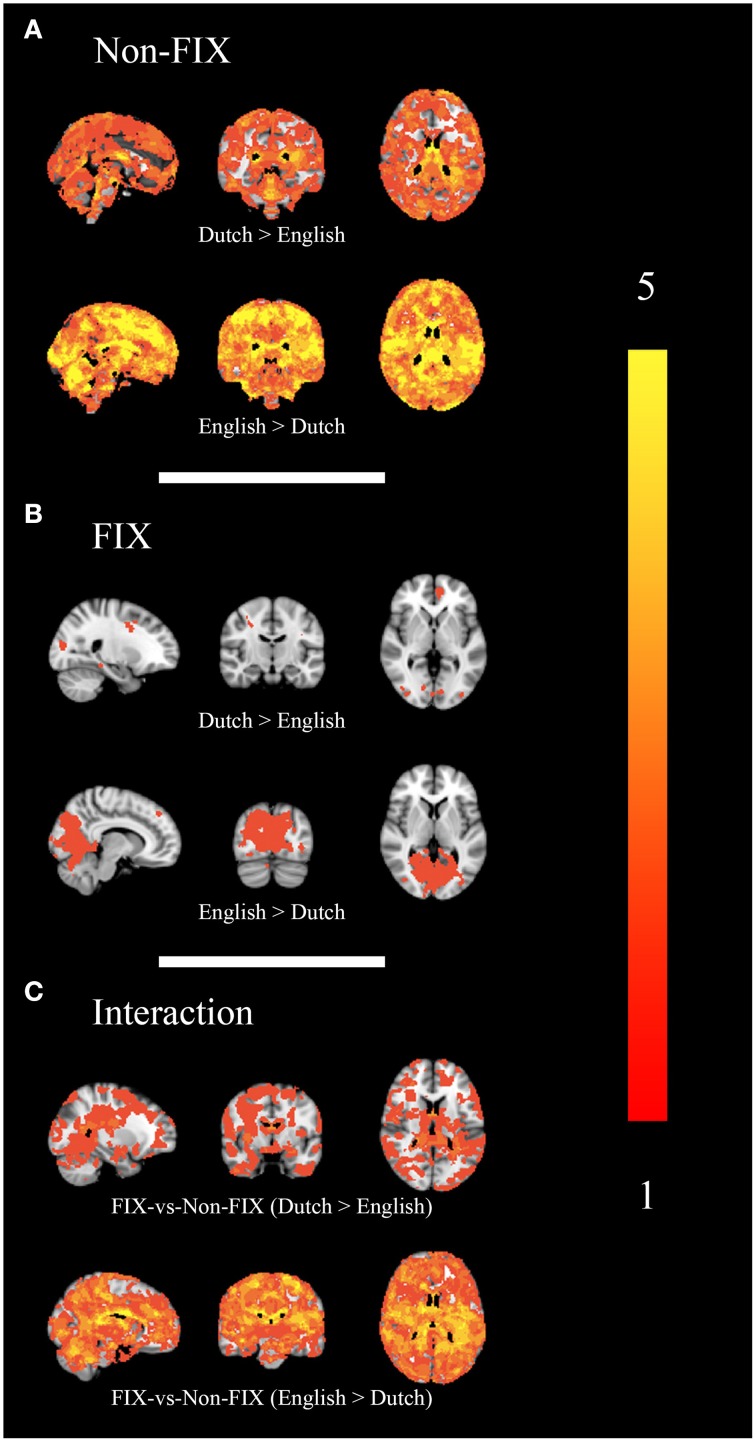
Figure 3.
Combined group differences. Maps show statistically significant (p < 0.05) differences between groups: without the use of FIX (A), after the use of FIX (B) and the interaction between FIX and group differences (C) in all (15) RSNs combined. Color bar represents the number of significantly differing networks.

