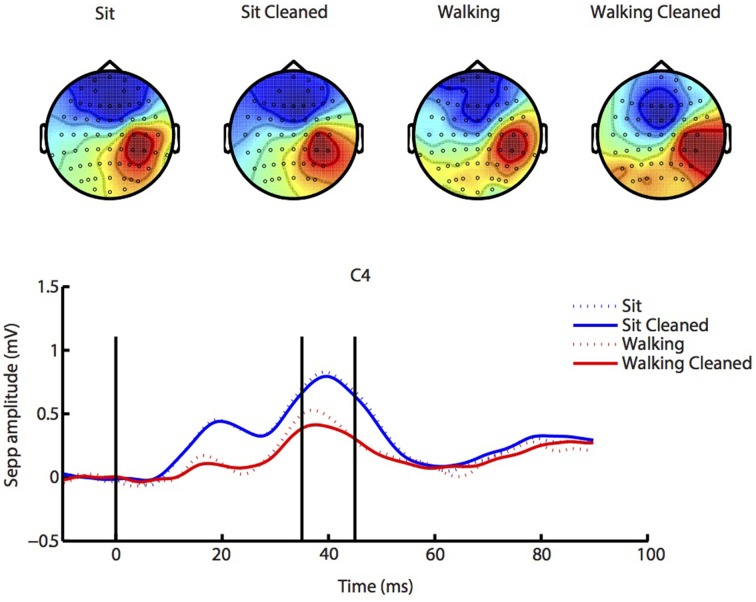
Figure 3.
SEP analysis. Similar SEP responses and accompanying scalp maps (from 35 to 45 ms post stimulus, indicated by vertical lines) were present during both sitting (blue lines) and walking (red lines), and our ICA cleaning procedure changed SEP amplitude only little (solid lines; cleaned), while clearly improving the scalp map. See Supplementary Figures 1–4 for source localization of SEP activity.

