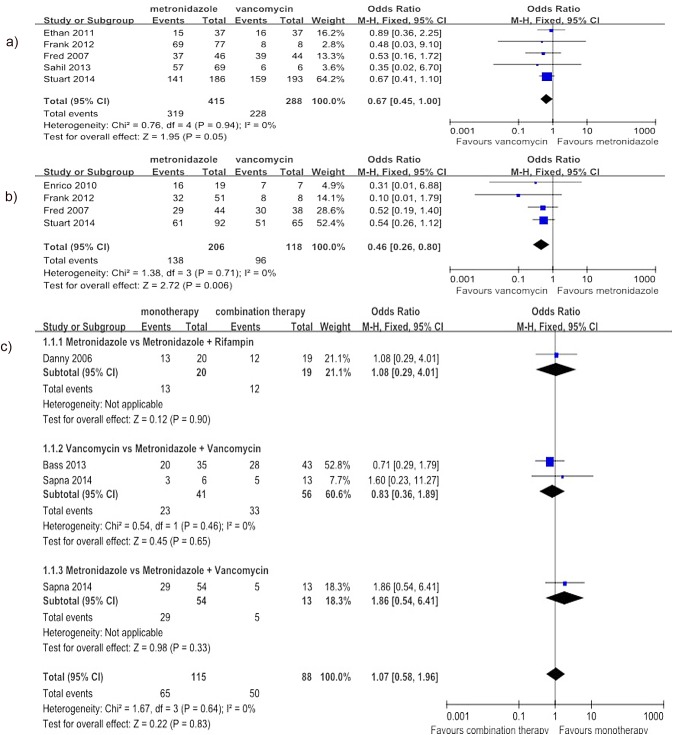
Fig 2. Forest plot of the rate of clinical cure (a: metronidazole vs. vancomycin for mild CDI; b: metronidazole vs. vancomycin for severe CDI; c: monotherapy vs. combination therapy).
The vertical line indicates no difference between the groups. ORs are represented by diamond shapes, and 95% CIs are depicted by horizontal lines. Squares indicate point estimates, and the size of each square indicates the weight of the given study in the meta-analysis. M-H, Mantel-Haenszel fixed-effects model.

