
Figure 3. Expression levels of oxidative stress and inflammation markers in the brain.
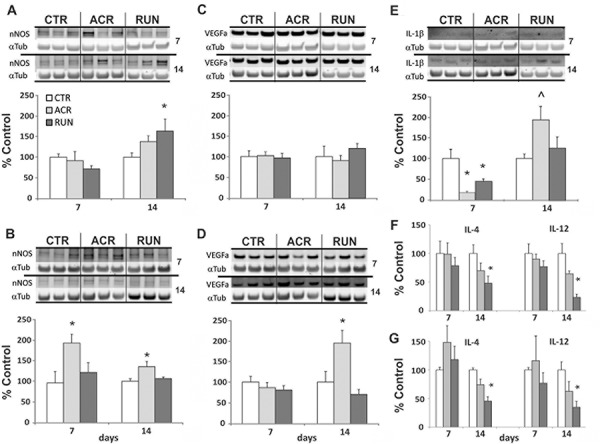
A. DG and B. LEC nNOS immunoblotting of tissue after 7 and 14 days of treatment in control (CTR), AICAR treated (ACR) and voluntary running (RUN) mice. (A) DG nNOS is increased in by running after 14 days. (B) LEC nNOS is elevated by AICAR at every time point. C. DG and D. LEC VEGFa immunoblotting. (C) DG VEGFa levels are not increased. (D) LEC VEGFa increases after 14 days of AICAR E. DG IL-1β immunoblotting after 7 and 14 days; IL-1β levels are reduced by both treatments after 7 days but increased by AICAR after 14 days. (*p < 0.05; ˄p = 0.052). F. DG and G. LEC inflammation markers ELISA shows that 14 days of running decreases IL-4 and IL-12 levels. (*p < 0.05). Error bars denote S.E.M.