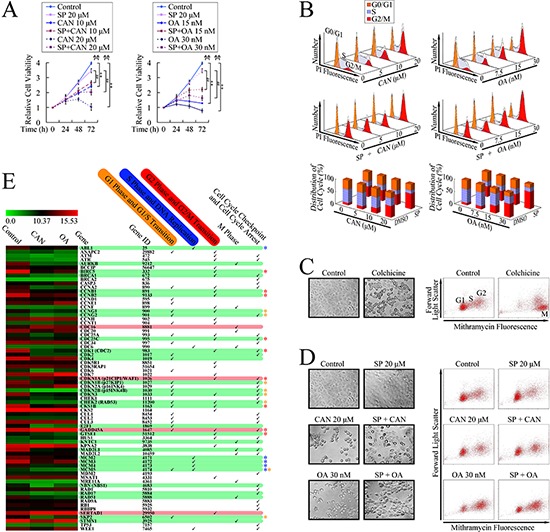
Figure 1. G2/M cell cycle arrest in PANC-1 cells after PP2A inhibitor treatment.

A. Growth curve of cantharidin (CAN), and okadaic acid (OA) treated cells, with or without the pretreatment with JNK inhibitor, SP600125 (SP). **P < 0.01 vs. respective control groups; ##P < 0.01 vs. SP600125 group; &&P < 0.01 induction between groups. B. DNA histogram and cell cycle distribution after treatment with cantharidin and OA, pretreated with or without SP600125. C. Photomicrographs of Colchicine treated cells (×40); and flow cytometry analyses based on mithramycin A staining. D. Photomicrographs of PP2A inhibitors and JNK inhibitor-treated cells (×40); and flow cytometry analyses based on mithramycin A staining. E. Illustration of the microarrays results. Up-regulated genes were highlighted in red below, and down-regulated genes were highlighted in green below. The differences in expression changes reached more than 2-fold are marked with colored * (yellow, genes involved in the regulation of G1 phase and G1/S cell cycle transition; blue, genes involved in the regulation of S phase; red, genes involved in the regulation of G2 phase and G2/M cell cycle transition).
