
Figure 2. Expression of CD133, CD166 and Lgr5 in parental and drug-resistant HCT-116 and HT-29 cells as determined by Western blot analysis.
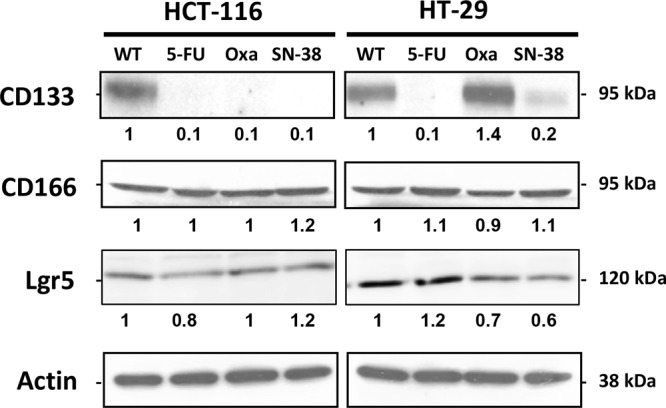
Actin was used as loading control. Relative protein levels were calculated by densitometry and are listed below the bands.