
Figure 6. A. Comparison of WNT-signaling in HT-29 and HCT-116 cells in comparison with DLD-1 and SW480 cells.
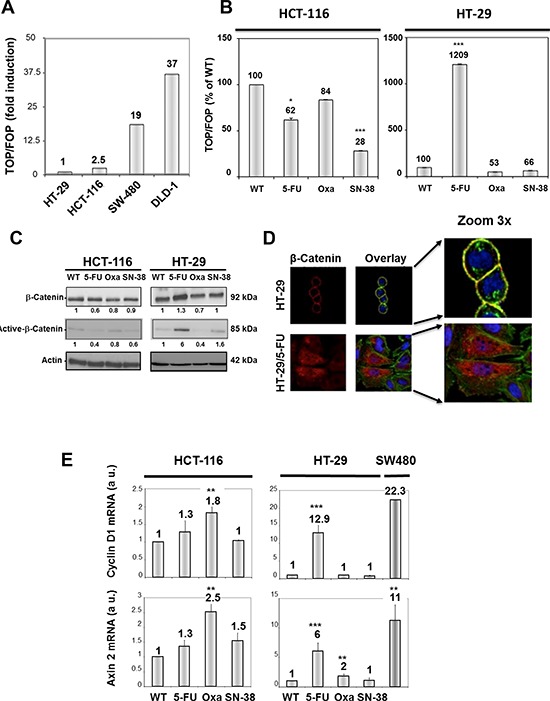
WNT pathway activation was determined after transfection with Top-Flash and Fop-Flash plasmid constructs and is expressed in comparison with the TOP/FOP luciferase activity in HT-29 cells. B. WNT-signaling in parental and resistant HCT-116 (left) and HT-29 cells (right) expressed as % of control. Bars, SD. *p < 0.05; **p < 0.01; ***p < 0.001 as determined by Student's t-test. C. Expression of total and unphosphorylated beta-catenin in parental and drug-resistant variants as determined by Western blot analysis. Actin was used as loading control. Relative protein levels were calculated by densitometry and are listed below the bands. D. Fluorescence microscopy of beta-catenin localization in HT-29 and HT-29/5-FU cells as determined by immunostaining with a beta-catenin-directed antibody (red). Nuclei were stained by DAPI (blue) while actin was revealed by phalloidin (green). The overlay outlines the localization of beta-catenin on the cytoplasmic membrane (yellow) in the parental, but not in the 5-FU resistant cells. E. Expression of Cyclin D and Axin 2 mRNA as determined by qRT-PCR. Data were derived from three independent experiments. Columns, relative mRNA expression of the indicated mRNA normalized to GAPDH. Bars, SD. *p < 0.05; **p < 0.01; ***p < 0.001 as determined by Student's t-test.