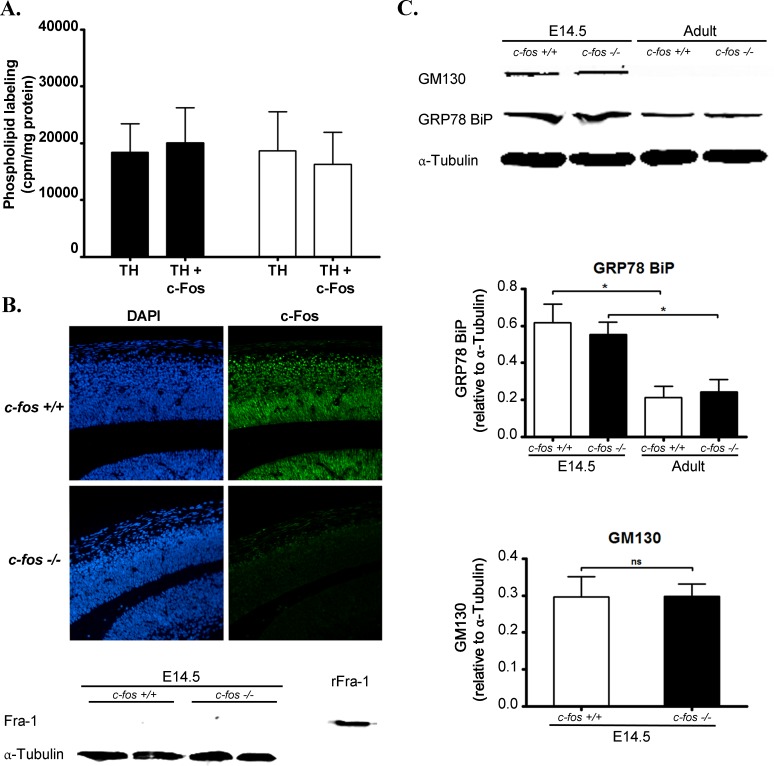
Figure 11. Phospholipid synthesis in the developing cerebral cortex.
A. Cerebral cortex of E14.5 c-fos +/+ (black bars) and c-fos −/− (white bars) embryos were used to prepare total homogenate (TH). TH´s were assayed for phospholipid synthesis capacity in the absence (TH) or presence (TH +c-Fos) of recombinant c-Fos at a final concentration of 1ng of c-Fos/μg of TH protein. Results are the mean cpm incorporated into phospholipids/mg protein ± SEM of 4 independent experiments performed in quadruplicate. B. Representative photomicrographs of the fluorescent staining for DAPI (left column, blue) and for c-Fos (right column, green) in brain coronal sections from the dorso-medial cerebral wall of c-fos +/+ and c-fos −/− embryos. Images were obtained with a fluorescence microscope (Olympus BX51) using a 40X objective. The bottom panel shows a Western blot for Fra-1 expression in total homogenate prepared from cerebral cortex of E14.5 c-fos +/+ (first 2 lanes) and c-fos −/− (lanes 3 and 4) embryos. The last lane corresponds to a sample of recombinant Fra-1 (rFra-1) used as a positive staining control. C. The expression of the Golgi marker GM130 (top row), of the ER marker GRP78 BiP and of α–Tubulin used as a loading control were determined by Western blot in cerebral cortex from E14.5 c-fos +/+ (first 2 lanes) and c-fos −/− (lanes 3 and 4) embryos and in c-fos +/+ and c-fos −/− adult cerebral cortex total homogenate. The levels of expression relative to α–Tubulin are shown in the histograms below for GRP78 BiP (top panel) and GM130 (bottom panel). The histogram represents the mean value ± SEM from five independent experiments. Note that levels of GM130 were below the level of detection in both c-fos +/+ and c-fos −/− adult samples whereas both c-fos +/+ and c-fos −/− embryos evidenced significantly higher relative GRP78 BiP expression with respect to adult animals. *p < 0.01 in embryos with respect to the adult as determined by two-way ANOVA with Bonferroni post-test.

