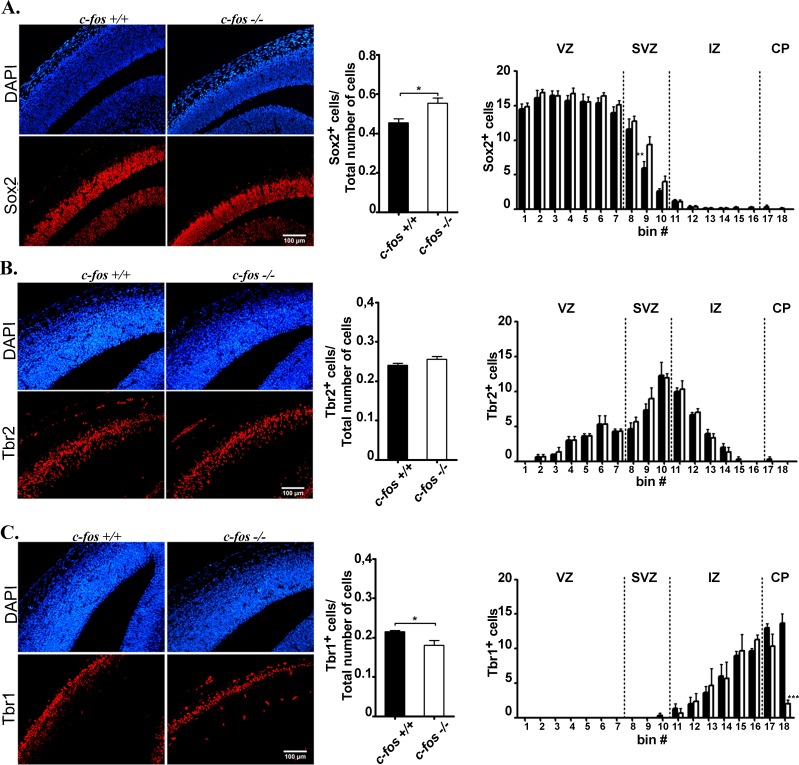
Figure 4. Cerebral cortex from E14.5 c-fos +/+ and c-fos −/− embryos differ in their cell populations.
Cortical slices staining for DAPI (blue) were analyzed in standard sectors of the dorso-medial cerebral wall. Segments of 100μm in the medial-lateral dimension were divided into 18 bins of 10 μm in height in its radial dimension. The sector was aligned such that the first bin was at the ventricle (V) surface with its long axis parallel to the ventricle border. Representative photomicrographs of the fluorescent staining shown in red (bottom row) for Sox2 A. Tbr2 B. and Tbr1 C. in brain coronal sections from the dorso-medial cerebral wall of c-fos +/+ and c-fos −/− embryos (left panel) are shown. Samples were stained for DAPI (blue, top row of A, B and C) and images obtained with a fluorescence microscope (Olympus BX51) using a 40X objective. The histograms show the quantification of the number of positive nuclei/total number of cells corresponding to Sox2 A., Tbr2 B. and Tbr1 C. (middle panel) and the quantification of the number of positive nuclei/bin for Sox2 A., Tbr2 B. and Tbr1 C. (left panel) staining respectively in brain coronal sections of E14.5 c-fos +/+ (black bars) and c-fos −/− (white bars) embryos, as indicated. Neocortex regions as shown in Figure 3D (VZ, SVZ, IZ and CP) are indicated. Results are the mean number of positive cells for each marker ± SEM from 4 sections of the 4 embryos examined per genotype. **p < 0.01; ***p < 0.001 in c-fos −/− samples with respect to the c-fos +/+ condition as determined by two-way ANOVA with Bonferroni post-test.

