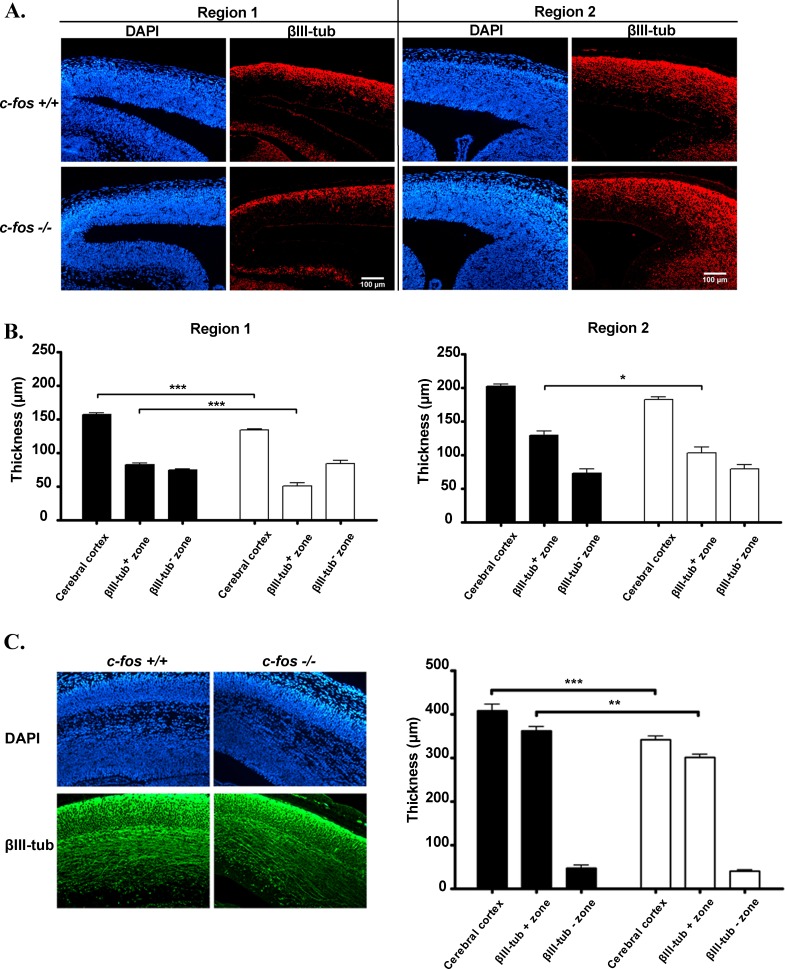
Figure 5. Neuronal differentiation is decreased in c-fos −/− embryo cerebral cortex.
A. Representative fluorescent photomicrographs of brain coronal sections obtained from two regions of the dorso-medial cerebral wall from E14.5 c-fos +/+ and c-fos −/− embryos stained for DAPI (blue) and βIII-tubulin (red). Images were obtained with a fluorescence microscope (Olympus BX51) using a 40X objective. B. Quantification of the thickness of the βIII-tubulin positive zone, βIII-tubulin negative zone and of the cerebral cortex of the regions shown in A, for c-fos +/+ (black bars) and c-fos −/− (white bars) embryos. C. Fluorescent photomicrographs for DAPI (blue) and βIII-tubulin (red) of brain coronal sections prepared from E16.5 c-fos +/+ and c-fos −/− embryos (left panel). Images were obtained with a fluorescence microscope (Olympus BX51) with a 40X objective. Quantification of the thickness of βIII-tubulin positive zone, βIII-tubulin negative zone and of the cerebral cortex of the figures shown (right panel), for c-fos +/+ (black bars) and c-fos −/− (white bars) embryos. Results are the mean thickness (μm) of the indicated zone ± SEM from 4 sections of 4 embryos of each genotype. *p < 0.05; **p < 0.01; ***p < 0.001 in c-fos −/− embryos with respect to the c-fos +/+ condition as determined by two-way ANOVA with Bonferroni post-test.

