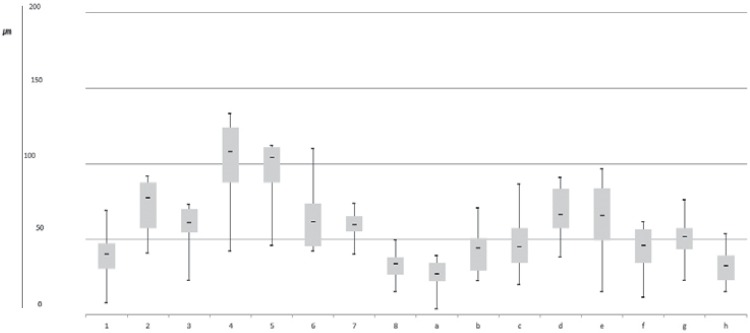
Figure 5. Accuracy of fit of each measuring point in group 3 (CEREC SW 4.2, 40 mm). Uppermost point and lowermost point indicate the highest and lowest values of results. The top of box and bottom of box indicate the 75% and 25% values of results. The midline in the box means the average of the results.