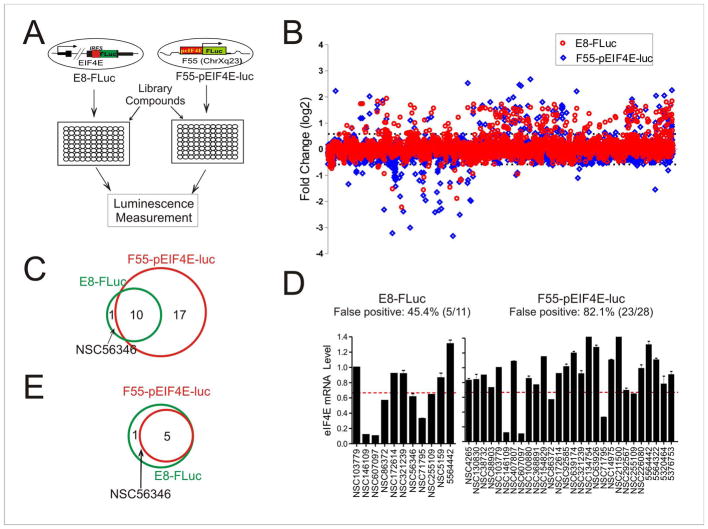
Figure 3. A drug screen using the bicistronic in-situ reporter assays identifies EIF4E inhibitors with a significantly reduced false positive rate.
(A) The schematic showing the screening strategy. A random E8-FLuc clone and a clone (F55-pEIF4E-luc) carrying a ~ 1.5 kb EIF4E promoter in a permissive genomic site were treated with library chemicals in microplates for luciferase activity assays. (B) The results of E8-FLuc-based screen (red) and F55-pEIF4E-luc-based screen (blue). Recombinant cells in 96-well plates were treated with ~ 4,800 compounds (2.5 μM) for 16 h, and then lysed for firefly luciferase activity assays. The relative luciferase activities were converted into logarithm values (binary logarithm, i.e., log2) and plotted for each compound. The cutoff values set for positives are ±0.5849, i.e., either decrease to at least 66.7% or increase to at least 150% of the DMSO group, and indicated by the dotted lines. Chemicals that decreased the luciferase activity due to cytotoxicity were identified by MTT assays, and excluded from further investigation in this study. These chemicals were not shown in this graph. (C) Venn Diagram showing the numbers of hits (i.e., decreasing the FLuc activity) from the screens using E8-FLuc or F55-pEIF4E-luc cells. (D) qRT-PCR validation of the hits from two screens. The dotted lines indicate the cutoff (<0.667) for positives. Error bars represent SD for three replicate measurements. (E) Venn Diagram showing the validated EIF4E inhibitors. See also Figure S2 and Figure S3.

