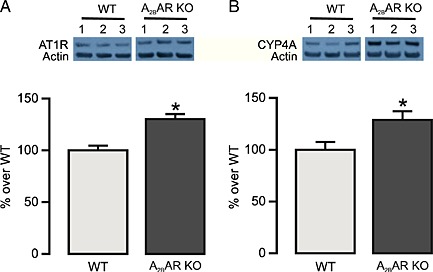
Figure 7.

Western blot analysis of AT1 receptors (AT1R) and CYP4A in MAs from WT and A2B receptor (A2BAR) KO mice. Top panel represents the expression of AT1 receptors (A) and CYP4A (B) in MAs from three mice. Bottom panel summarizes the quantification of data obtained from six mice in each group. * P < 0.05 compared with WT.
