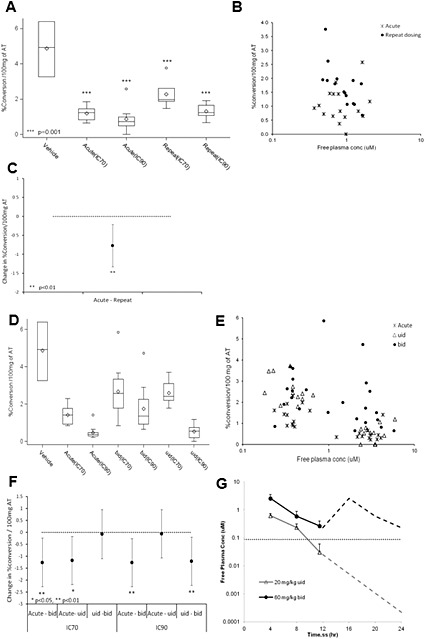
Figure 3.

Rat study B with AZD8329: (A) Box and whisker plot of ex vivo activity of rat 11β‐HSD1 enzyme in epididymal AT (measured conversion of 3H‐cortisone to 3H‐cortisol) after acute and repeat oral administration, per treatment group of AZD8329 (n = 12), comparison of the vehicle (n = 8) versus the treated groups (box and whisker plot shows the median (central line), the upper and lower quartiles (top and bottom of the box) and the range of the data (whiskers). If there are data points more than 1.5× the interquartile range (IQR) above the upper quartile (or below the lower quartile), then these points are singled out and presented separately. *** P < 0.001, significantly different from vehicle. (B) Comparison of the PK/PD relationship between rat 11β‐HSD1 enzyme activity and free plasma concentrations of AZD8329 after acute and repeated (7 days) oral administration in rats.. (C) Treatment groups statistical comparison of the ex vivo activity of the rat 11β‐HSD1 enzyme in epididymal AT. The confidence intervals are 95% (with Sidak's multiple comparison adjustment) so statistical significance was inferred if the 95% confidence interval did not span zero. **P< ,0.01. Rat experiment with COMPOUND‐20: (D) Box and whisker plot of ex vivo activity of rat 11β‐HSD1 enzyme in epididymal AT (measured conversion of 3H‐cortisone to 3H‐cortisol) after acute and repeat oral administration (u.i.d. and b.i.d.), per treatment group of COMPOUND‐20 (n = 12), comparison of the vehicle (n = 8) versus the treated groups. (E) Comparison of the PK/PD relationship between rat 11β‐HSD1 enzyme activity and free plasma concentrations of COMPOUND‐20 after acute and repeat (b.i.d. or u.i.d. for 7 days) oral administration in rats. (F) Treatment groups statistical comparison of the ex vivo activity of the rat 11β‐HSD1 enzyme in epididymal AT. The confidence intervals are 95% (with Sidak's multiple comparison adjustment). *P < 0.05, **P < 0.01. (G) Free plasma concentrations (+SD) of COMPOUND‐20 in rats following a daily dose of COMPOUND‐20 at either 20 mg · kg−1 u.i.d. or 60 mg · kg−1 b.i.d.. Horizontal dotted line indicates ‘efficacious’ concentrations based on acute IC50 for the inhibition of rat 11β‐HSD1 activity in the adipose tissue. Results shown are measured plasma concentrations of COMPOUND‐20 for the first 12 h on day 6. The second 12 h are simulated based on results from the first 12 h.
