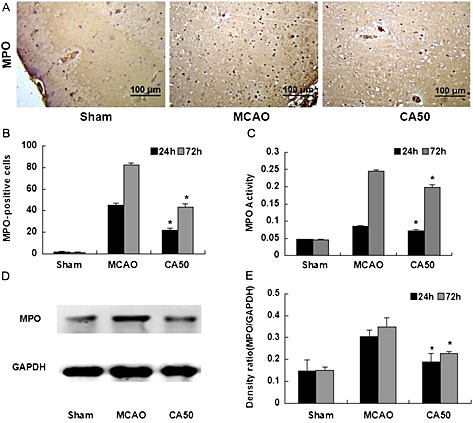
Figure 3.

Effect of cinnamaldehyde on MPO expression and activity. (A) MPO staining in cerebral cortex in different groups at 24 h after cerebral ischaemia (200 × magnification). (B) Quantification of MPO‐positive cells in cerebral cortex in different groups at 24 and 72 h after cerebral ischaemia. Results shown are the means ± SEM, n = 6 * P < 0.05, versus same time‐point MCAO group;one‐way ANOVA with Student–Newman–Keuls test. (C) Bar graph of MPO activity in cerebral cortex in different groups at 24 and 72 h after cerebral ischaemia. Results shown are the means ± SEM, n = 6 * P < 0.05, versus same time‐point MCAO group;one‐way ANOVA with Student–Newman–Keuls test. (D) Western blotting analysis of MPO in cerebral cortex in different groups at 24 h after cerebral ischaemia. (E) Quantification of protein level of MPO in different groups at 24 and 72 h after cerebral ischaemia. Results shown are the means ± SEM, n = 6 * P < 0.05, versus same time‐point MCAO group;one‐way ANOVA with Student–Newman–Keuls test.
