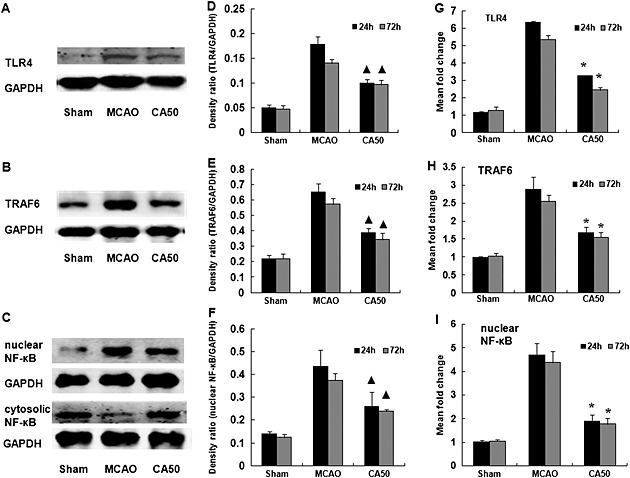
Figure 5.

Effect of cinnamaldehyde on protein and mRNA expression of TLR4, TRAF6 and NF‐κB in the cerebral cortex. (A)–(C) Western blotting analysis of total TLR4, TRAF6 and nuclear/cytosolic NF‐κB in cerebral cortex in different groups at 24 h after cerebral ischaemia. (D)–(F) Quantification of protein level of total TLR4, TRAF6 and nuclear NF‐κB in different groups at 24 and 72 h after cerebral ischaemia. Results shown are the means ± SEM, n = 3. ▲ P < 0.05, versus same time‐point MCAO group;one‐way ANOVA with Student–Newman–Keuls test. (G)–(I) The mRNA levels of TLR4, TRAF6 and NF‐κB in cerebral cortex were shown by bar graphs at 24 and 72 h after cerebral ischaemia. Results shown are the means ± SEM, n = 6 * P < 0.05, versus same time‐point MCAO group;one‐way ANOVA with Student–Newman–Keuls test.
