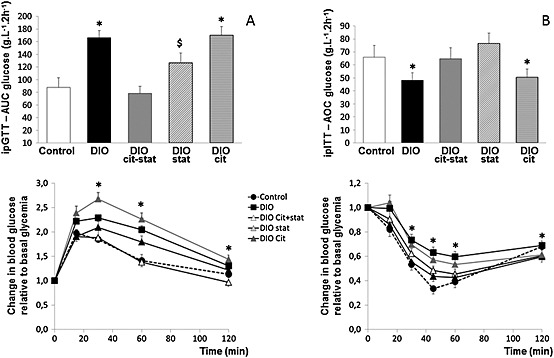
Figure 2.

(A) Glucose tolerance [intraperitoneal glucose tolerance test (ipGTT)] and glycemic response to ipGTT, and (B) insulin sensitivity [intraperitoneal insulin sensitivity tolerance test (ipITT)] and glycemic responses to ipITT in diet‐induced obese (DIO) mice treated or not with citrulline (cit) and/or atorvastatin (stat) compared with control lean mice. Glycemic responses are expressed relative to basal blood glucose. * P < 0.05, significantly different from controls; $ P < 0.05, significantly different from DIOcit–stat group.
