
Figure 3.
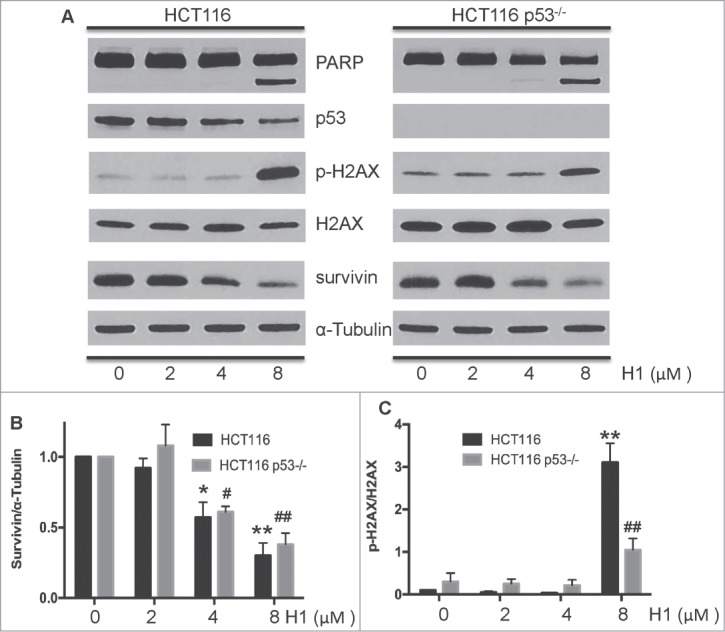
H1 caused p53-independent cytotoxic effect. Cells were treated with different concentrations of H1 for 24 h. Then, cells were rinsed and lysed containing freshly added Protease Inhibitor Cocktail. Expression level of cleaved PARP, survivin, p53, p-H2AX and total H2AX were determined by western blot analysis. A representative of 3–4 experiments is shown. *P < 0.05, **P < 0.01; #P < 0.05, ##P < 0.01 vs. each control group.