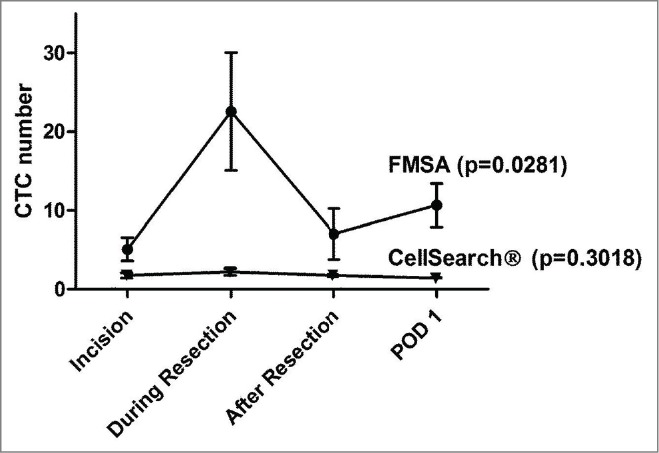
Figure 1.

CTC dissemination kinetics during CRC liver and lung metastasectomy. Blood (7.5 ml) was drawn at incision, during resection, 30 min after resection and on postoperative day 1 (POD 1) during CRC liver (n = 16) and lung (n = 9) metastasectomy. CTC isolation and enumeration was performed with FDA-approved CellSearch® and a novel filter isolation technique (FMSA) that enables enrichment by size. CTCs peaked statistically significant during resection with the FMSA device in comparison to the other 3 time points tested with the FMSA. With the FMSA, CTC numbers were not significantly different between incision (baseline) and POD 1 (p = 0.2024, Mann-Whitney U test). However, CTC numbers were not significantly different with the CellSearch® system comparing the 4 time points. Shown are mean CTC values, and bars represent ± standard error of the mean (SEM). P values were calculated with repeated-measures ANOVA model.
