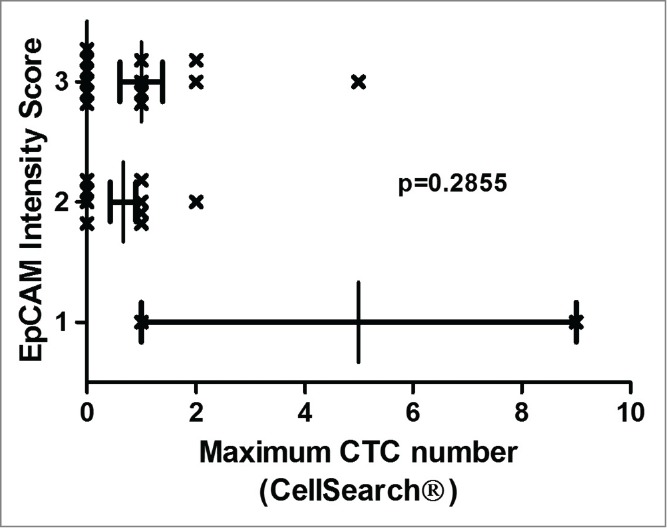
Figure 3.

EpCAM expression intensity and CTC numbers. EpCAM expression was analyzed immunohistochemically with monoclonal BerEP4 antibody in resected CRC liver and lung metastases tissue. EpCAM expression was graded by a staining intensity score (score 0–3 (0: no expression, 3: highest intensity)). The mean EpCAM intensity score was high with a mean of 2.48 (SEM ±0.13) and a median of 3 (range 1–3). Patients with no CTCs detectable by CellSearch had consistently high EpCAM expression intensity scores. Non-parametric ANOVA analysis revealed no statistically significant association between the maximum CTC numbers and EpCAM intensity scores (p = 0.2855).
