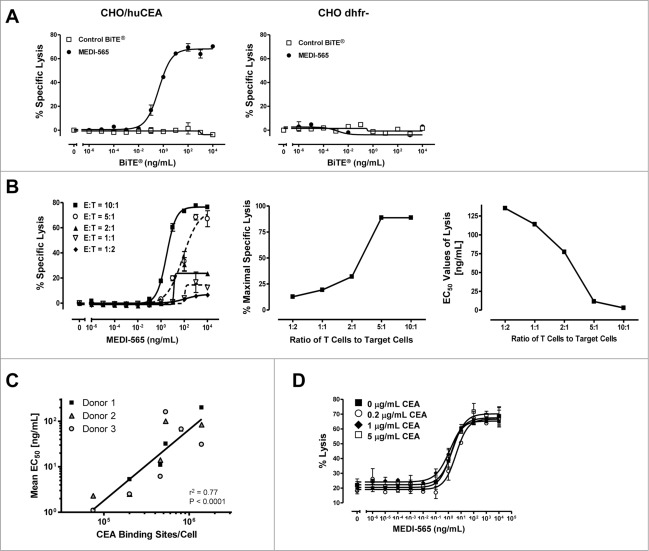
Figure 2.
Factors that influence MEDI-565-induced T cell killing of target cells: CEA expression on target cells, the presence of soluble CEA and effector:target ratios. (A) Activity of MEDI-565 (•) or control BiTE® antibody (□) to induce T cell killing of CEA positive CHO cells (CHO/huCEA) and CEA negative parental CHO cells (CHO dhfr-). (B) Effect of the indicated effector-to-target cell ratio on MEDI-565-induced T cell killing of CHO/huCEA cells over a range of MEDI-565 concentrations. In addition, the relationship between the maximum specific lysis and the EC50 values of lysis achieved in cytotoxicity assays are graphed versus E:T ratios. (C) Correlation (r2 = 0.77) of the estimated number of CEA binding sites for MEDI-565 on the surface of tumor cell lines with the potency (EC50 values) of redirected T cell lysis. The measured number of CEA molecules per cell for each of 6 tumor cell lines (ASPC-1, BxPC3, HPAC, HPAF II, H727 and LS174T) was plotted against the respective EC50 values of the percentage of tumor cells lysed from 3 individual donor T cells. P and r2 of the linear regression curve are listed on the graph. r2, coefficient of determination, calculated from Pearson's correlation coefficient (r). (D) Effect of the indicated concentrations of soluble CEA on MEDI-565 induced T cell killing of CHO/huCEA cells during a 72 hour assay. Data in the figure show representative results for assays using T cells from 3 different donors. All target cells were cultured for 72 hours with unstimulated human CD3+ T cells at an E:T ratio of 10:1 or as indicated in the figure. Error bars show the SEM in panels A, B and D.

