Figure 2.

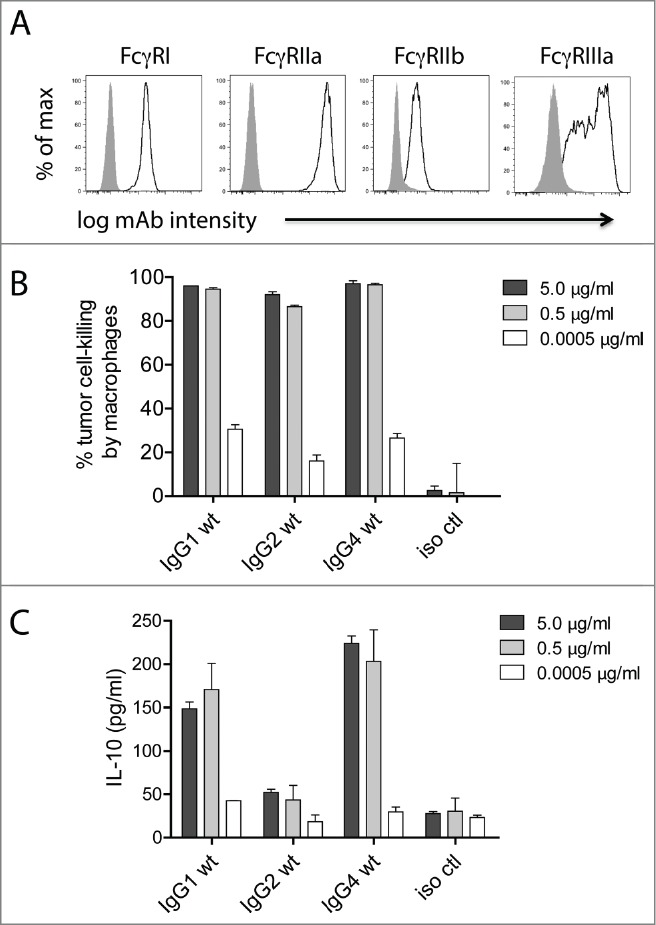
Macrophage tumor-cell-killing is uncoupled from ADCR. (A) Flow cytometry analysis for the cell surface expression of macrophage FcγRI, FcγRIIa, FcγRIIb, and FcγRIIIa. Isotype controls are shown as solid gray and FcγRs are shown as open lines. 24 h macrophage tumor cell-killing (B) and ADCR from the same experiment (C) are shown. Supernatants were collected after 24 h, and the IL-10 levels were measured using ELISA. Data are representative of 4 independent experiments (duplicate measurements per experiment).
