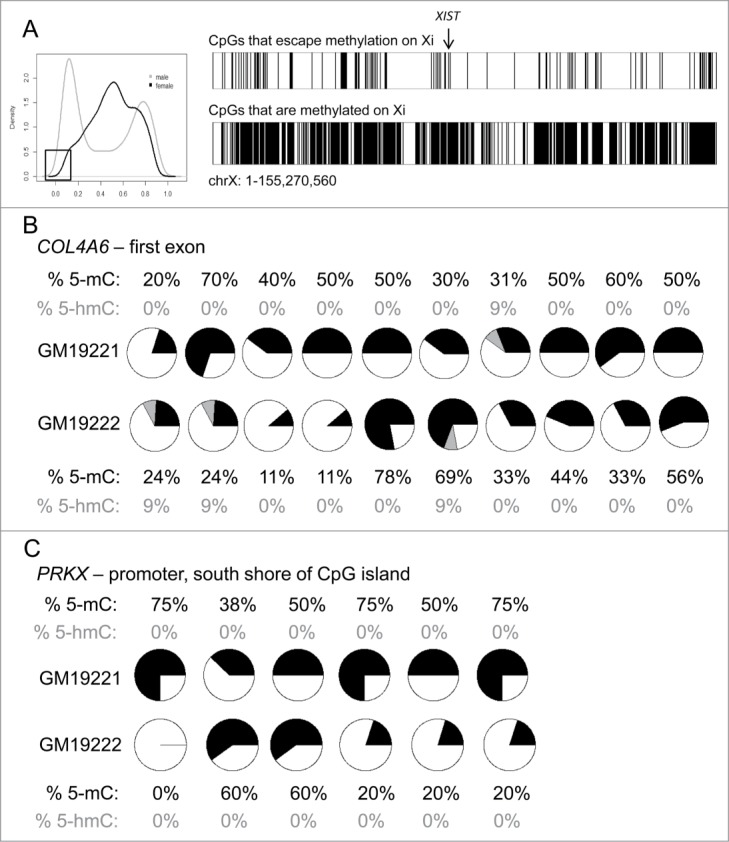
Figure 2.

Identification of CpGs that escape methylation on the Xi (A) Location of CpGs that escape methylation (top) or are subjected to methylation (bottom) on the Xi. The location of the non-coding RNA XIST is denoted with an arrow. (B–C) Tet-assisted bisulfite sequencing of 2 genes, COL4A6 (B) and PRKX (C). Each pie chart represents a CpG captured by the bisulfite PCR. The proportion of 5mC is shown in black, the proportion of 5hmC is shown in gray, and the proportion of unmodified cytosine is shown in white.
