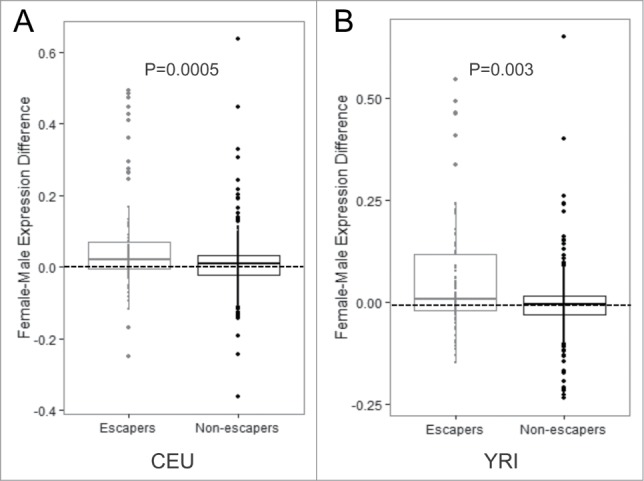
Figure 3.

Genes with CpGs predicted to escape inactivation have increased levels of expression (A–B) Expression values for genes containing CpGs that escape methylation compared with genes containing CpGs that are subject to methylation on the Xi in the CEU population (A) and the YRI population (B). P-values were calculated using the Student's t-test.
