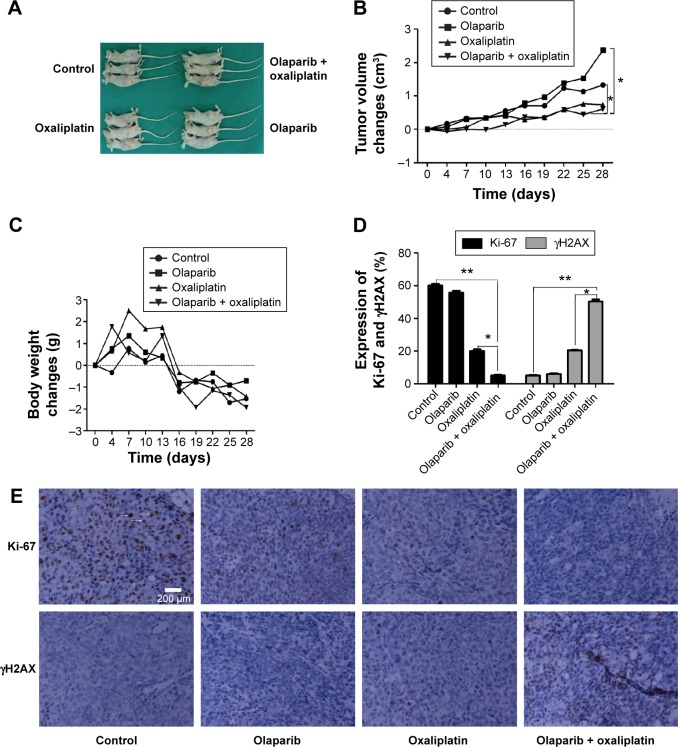
Figure 4.
Illustrations of the animal experiments.
Notes: (A) Images of the executed mice. (B) The tumor volume changes for each group of mice (tumor volume change = tumor volume at days after treatment – original volume). (C) The weight changes of each group of mice (tumor weight change = tumor weight at days after treatment – original weight). (D) Bar graph illustrating the distribution of protein in tissue cells following exposure to olaparib and/or oxaliplatin. (E) Representative images of Ki67 and γH2AX in tissue sections of the xenograft model following different treatments (400-fold). The arrows indicate Ki67-positive cells. The scale bar represents 200 µm. Values represent the proportion of positive staining cells compared to the total number of cells. *P<0.05 and **P<0.01 (Student’s t-test).
Abbreviation: γH2AX, gamma histone variant H2AX.

