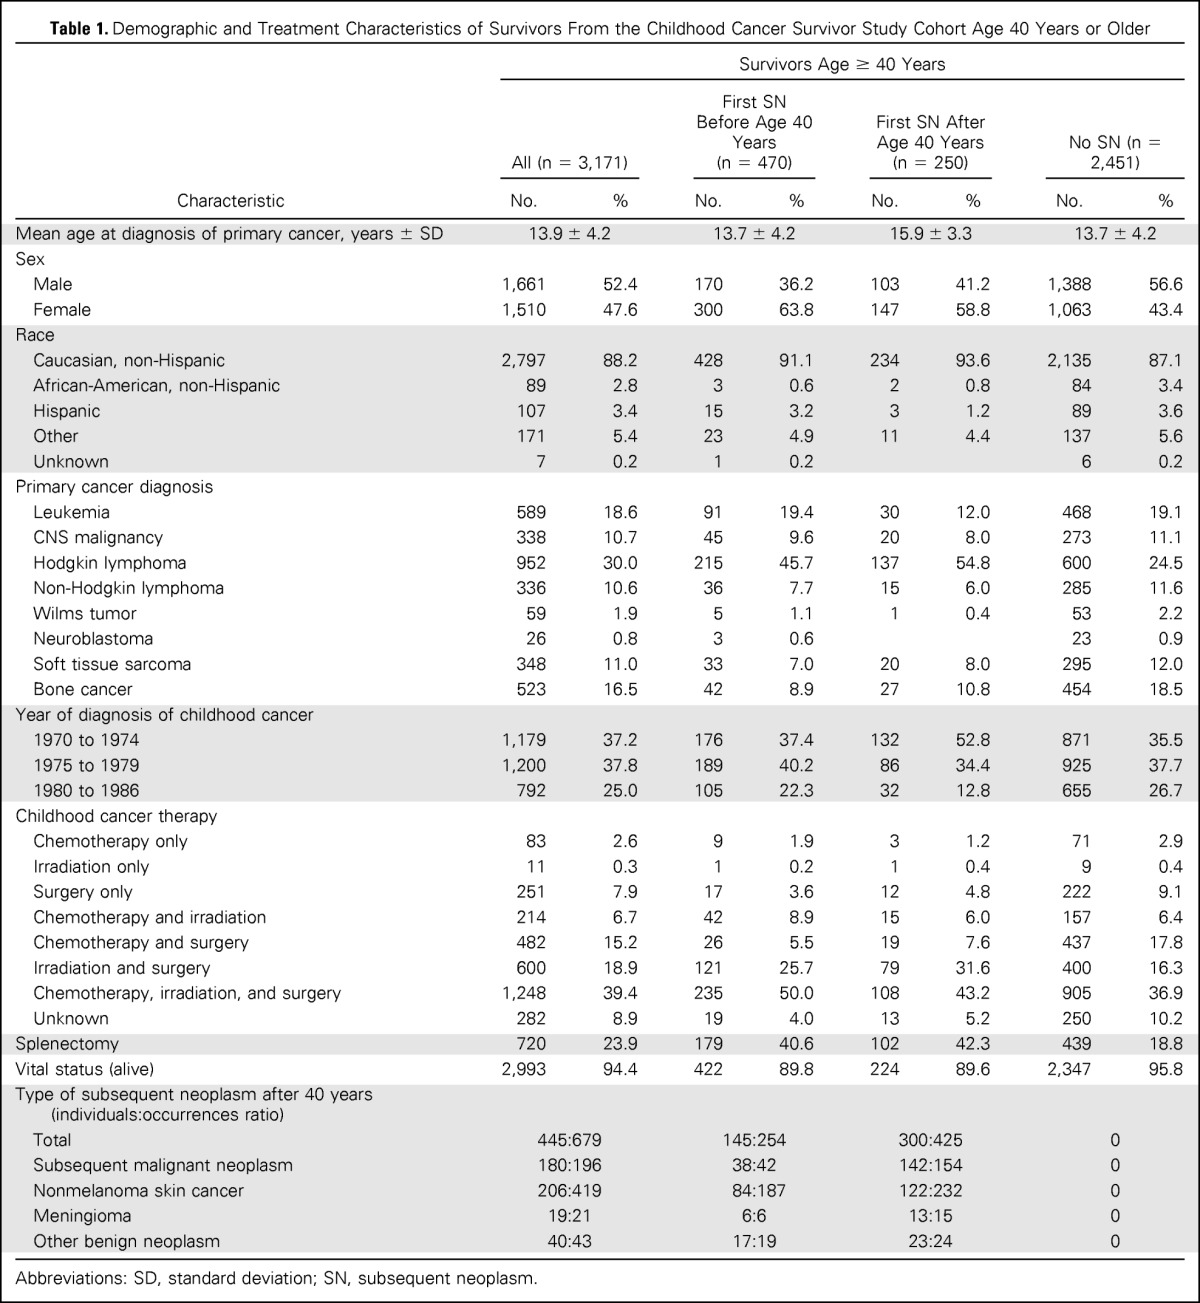
Table 1.
Demographic and Treatment Characteristics of Survivors From the Childhood Cancer Survivor Study Cohort Age 40 Years or Older

| Characteristic | Survivors Age ≥ 40 Years |
|||||||
|---|---|---|---|---|---|---|---|---|
| All (n = 3,171) |
First SN Before Age 40 Years (n = 470) |
First SN After Age 40 Years (n = 250) |
No SN (n = 2,451) |
|||||
| No. | % | No. | % | No. | % | No. | % | |
| Mean age at diagnosis of primary cancer, years ± SD | 13.9 ± 4.2 | 13.7 ± 4.2 | 15.9 ± 3.3 | 13.7 ± 4.2 | ||||
| Sex | ||||||||
| Male | 1,661 | 52.4 | 170 | 36.2 | 103 | 41.2 | 1,388 | 56.6 |
| Female | 1,510 | 47.6 | 300 | 63.8 | 147 | 58.8 | 1,063 | 43.4 |
| Race | ||||||||
| Caucasian, non-Hispanic | 2,797 | 88.2 | 428 | 91.1 | 234 | 93.6 | 2,135 | 87.1 |
| African-American, non-Hispanic | 89 | 2.8 | 3 | 0.6 | 2 | 0.8 | 84 | 3.4 |
| Hispanic | 107 | 3.4 | 15 | 3.2 | 3 | 1.2 | 89 | 3.6 |
| Other | 171 | 5.4 | 23 | 4.9 | 11 | 4.4 | 137 | 5.6 |
| Unknown | 7 | 0.2 | 1 | 0.2 | 6 | 0.2 | ||
| Primary cancer diagnosis | ||||||||
| Leukemia | 589 | 18.6 | 91 | 19.4 | 30 | 12.0 | 468 | 19.1 |
| CNS malignancy | 338 | 10.7 | 45 | 9.6 | 20 | 8.0 | 273 | 11.1 |
| Hodgkin lymphoma | 952 | 30.0 | 215 | 45.7 | 137 | 54.8 | 600 | 24.5 |
| Non-Hodgkin lymphoma | 336 | 10.6 | 36 | 7.7 | 15 | 6.0 | 285 | 11.6 |
| Wilms tumor | 59 | 1.9 | 5 | 1.1 | 1 | 0.4 | 53 | 2.2 |
| Neuroblastoma | 26 | 0.8 | 3 | 0.6 | 23 | 0.9 | ||
| Soft tissue sarcoma | 348 | 11.0 | 33 | 7.0 | 20 | 8.0 | 295 | 12.0 |
| Bone cancer | 523 | 16.5 | 42 | 8.9 | 27 | 10.8 | 454 | 18.5 |
| Year of diagnosis of childhood cancer | ||||||||
| 1970 to 1974 | 1,179 | 37.2 | 176 | 37.4 | 132 | 52.8 | 871 | 35.5 |
| 1975 to 1979 | 1,200 | 37.8 | 189 | 40.2 | 86 | 34.4 | 925 | 37.7 |
| 1980 to 1986 | 792 | 25.0 | 105 | 22.3 | 32 | 12.8 | 655 | 26.7 |
| Childhood cancer therapy | ||||||||
| Chemotherapy only | 83 | 2.6 | 9 | 1.9 | 3 | 1.2 | 71 | 2.9 |
| Irradiation only | 11 | 0.3 | 1 | 0.2 | 1 | 0.4 | 9 | 0.4 |
| Surgery only | 251 | 7.9 | 17 | 3.6 | 12 | 4.8 | 222 | 9.1 |
| Chemotherapy and irradiation | 214 | 6.7 | 42 | 8.9 | 15 | 6.0 | 157 | 6.4 |
| Chemotherapy and surgery | 482 | 15.2 | 26 | 5.5 | 19 | 7.6 | 437 | 17.8 |
| Irradiation and surgery | 600 | 18.9 | 121 | 25.7 | 79 | 31.6 | 400 | 16.3 |
| Chemotherapy, irradiation, and surgery | 1,248 | 39.4 | 235 | 50.0 | 108 | 43.2 | 905 | 36.9 |
| Unknown | 282 | 8.9 | 19 | 4.0 | 13 | 5.2 | 250 | 10.2 |
| Splenectomy | 720 | 23.9 | 179 | 40.6 | 102 | 42.3 | 439 | 18.8 |
| Vital status (alive) | 2,993 | 94.4 | 422 | 89.8 | 224 | 89.6 | 2,347 | 95.8 |
| Type of subsequent neoplasm after 40 years (individuals:occurrences ratio) | ||||||||
| Total | 445:679 | 145:254 | 300:425 | 0 | ||||
| Subsequent malignant neoplasm | 180:196 | 38:42 | 142:154 | 0 | ||||
| Nonmelanoma skin cancer | 206:419 | 84:187 | 122:232 | 0 | ||||
| Meningioma | 19:21 | 6:6 | 13:15 | 0 | ||||
| Other benign neoplasm | 40:43 | 17:19 | 23:24 | 0 | ||||
Abbreviations: SD, standard deviation; SN, subsequent neoplasm.
