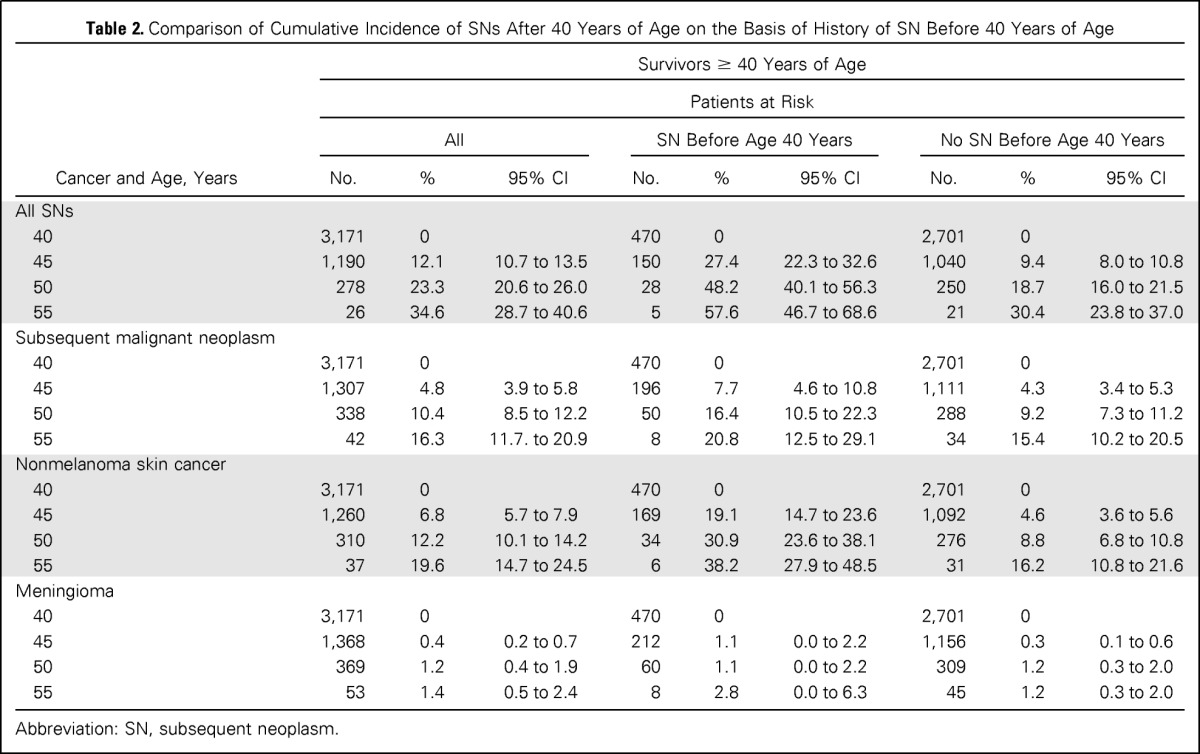
Table 2.
Comparison of Cumulative Incidence of SNs After 40 Years of Age on the Basis of History of SN Before 40 Years of Age

| Cancer and Age, Years | Survivors ≥ 40 Years of Age |
||||||||
|---|---|---|---|---|---|---|---|---|---|
| Patients at Risk | |||||||||
| All |
SN Before Age 40 Years |
No SN Before Age 40 Years |
|||||||
| No. | % | 95% CI | No. | % | 95% CI | No. | % | 95% CI | |
| All SNs | |||||||||
| 40 | 3,171 | 0 | 470 | 0 | 2,701 | 0 | |||
| 45 | 1,190 | 12.1 | 10.7 to 13.5 | 150 | 27.4 | 22.3 to 32.6 | 1,040 | 9.4 | 8.0 to 10.8 |
| 50 | 278 | 23.3 | 20.6 to 26.0 | 28 | 48.2 | 40.1 to 56.3 | 250 | 18.7 | 16.0 to 21.5 |
| 55 | 26 | 34.6 | 28.7 to 40.6 | 5 | 57.6 | 46.7 to 68.6 | 21 | 30.4 | 23.8 to 37.0 |
| Subsequent malignant neoplasm | |||||||||
| 40 | 3,171 | 0 | 470 | 0 | 2,701 | 0 | |||
| 45 | 1,307 | 4.8 | 3.9 to 5.8 | 196 | 7.7 | 4.6 to 10.8 | 1,111 | 4.3 | 3.4 to 5.3 |
| 50 | 338 | 10.4 | 8.5 to 12.2 | 50 | 16.4 | 10.5 to 22.3 | 288 | 9.2 | 7.3 to 11.2 |
| 55 | 42 | 16.3 | 11.7. to 20.9 | 8 | 20.8 | 12.5 to 29.1 | 34 | 15.4 | 10.2 to 20.5 |
| Nonmelanoma skin cancer | |||||||||
| 40 | 3,171 | 0 | 470 | 0 | 2,701 | 0 | |||
| 45 | 1,260 | 6.8 | 5.7 to 7.9 | 169 | 19.1 | 14.7 to 23.6 | 1,092 | 4.6 | 3.6 to 5.6 |
| 50 | 310 | 12.2 | 10.1 to 14.2 | 34 | 30.9 | 23.6 to 38.1 | 276 | 8.8 | 6.8 to 10.8 |
| 55 | 37 | 19.6 | 14.7 to 24.5 | 6 | 38.2 | 27.9 to 48.5 | 31 | 16.2 | 10.8 to 21.6 |
| Meningioma | |||||||||
| 40 | 3,171 | 0 | 470 | 0 | 2,701 | 0 | |||
| 45 | 1,368 | 0.4 | 0.2 to 0.7 | 212 | 1.1 | 0.0 to 2.2 | 1,156 | 0.3 | 0.1 to 0.6 |
| 50 | 369 | 1.2 | 0.4 to 1.9 | 60 | 1.1 | 0.0 to 2.2 | 309 | 1.2 | 0.3 to 2.0 |
| 55 | 53 | 1.4 | 0.5 to 2.4 | 8 | 2.8 | 0.0 to 6.3 | 45 | 1.2 | 0.3 to 2.0 |
Abbreviation: SN, subsequent neoplasm.
