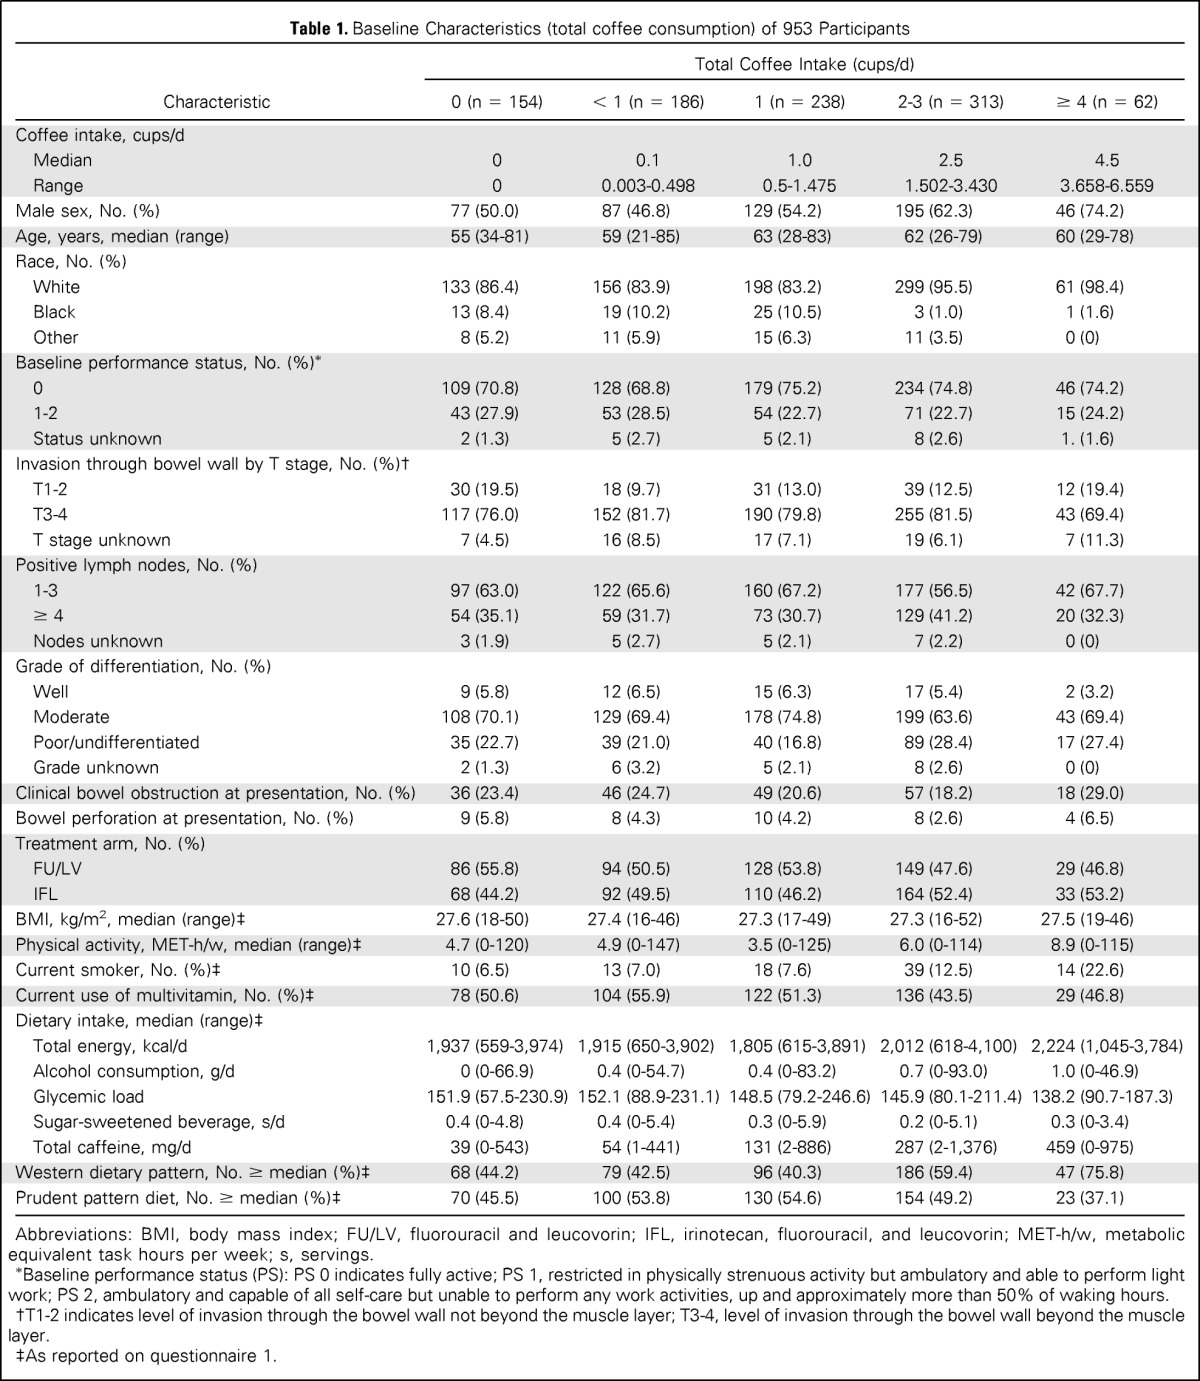
Table 1.
Baseline Characteristics (total coffee consumption) of 953 Participants

| Characteristic | Total Coffee Intake (cups/d) |
||||
|---|---|---|---|---|---|
| 0 (n = 154) | < 1 (n = 186) | 1 (n = 238) | 2-3 (n = 313) | ≥ 4 (n = 62) | |
| Coffee intake, cups/d | |||||
| Median | 0 | 0.1 | 1.0 | 2.5 | 4.5 |
| Range | 0 | 0.003-0.498 | 0.5-1.475 | 1.502-3.430 | 3.658-6.559 |
| Male sex, No. (%) | 77 (50.0) | 87 (46.8) | 129 (54.2) | 195 (62.3) | 46 (74.2) |
| Age, years, median (range) | 55 (34-81) | 59 (21-85) | 63 (28-83) | 62 (26-79) | 60 (29-78) |
| Race, No. (%) | |||||
| White | 133 (86.4) | 156 (83.9) | 198 (83.2) | 299 (95.5) | 61 (98.4) |
| Black | 13 (8.4) | 19 (10.2) | 25 (10.5) | 3 (1.0) | 1 (1.6) |
| Other | 8 (5.2) | 11 (5.9) | 15 (6.3) | 11 (3.5) | 0 (0) |
| Baseline performance status, No. (%)* | |||||
| 0 | 109 (70.8) | 128 (68.8) | 179 (75.2) | 234 (74.8) | 46 (74.2) |
| 1-2 | 43 (27.9) | 53 (28.5) | 54 (22.7) | 71 (22.7) | 15 (24.2) |
| Status unknown | 2 (1.3) | 5 (2.7) | 5 (2.1) | 8 (2.6) | 1. (1.6) |
| Invasion through bowel wall by T stage, No. (%)† | |||||
| T1-2 | 30 (19.5) | 18 (9.7) | 31 (13.0) | 39 (12.5) | 12 (19.4) |
| T3-4 | 117 (76.0) | 152 (81.7) | 190 (79.8) | 255 (81.5) | 43 (69.4) |
| T stage unknown | 7 (4.5) | 16 (8.5) | 17 (7.1) | 19 (6.1) | 7 (11.3) |
| Positive lymph nodes, No. (%) | |||||
| 1-3 | 97 (63.0) | 122 (65.6) | 160 (67.2) | 177 (56.5) | 42 (67.7) |
| ≥ 4 | 54 (35.1) | 59 (31.7) | 73 (30.7) | 129 (41.2) | 20 (32.3) |
| Nodes unknown | 3 (1.9) | 5 (2.7) | 5 (2.1) | 7 (2.2) | 0 (0) |
| Grade of differentiation, No. (%) | |||||
| Well | 9 (5.8) | 12 (6.5) | 15 (6.3) | 17 (5.4) | 2 (3.2) |
| Moderate | 108 (70.1) | 129 (69.4) | 178 (74.8) | 199 (63.6) | 43 (69.4) |
| Poor/undifferentiated | 35 (22.7) | 39 (21.0) | 40 (16.8) | 89 (28.4) | 17 (27.4) |
| Grade unknown | 2 (1.3) | 6 (3.2) | 5 (2.1) | 8 (2.6) | 0 (0) |
| Clinical bowel obstruction at presentation, No. (%) | 36 (23.4) | 46 (24.7) | 49 (20.6) | 57 (18.2) | 18 (29.0) |
| Bowel perforation at presentation, No. (%) | 9 (5.8) | 8 (4.3) | 10 (4.2) | 8 (2.6) | 4 (6.5) |
| Treatment arm, No. (%) | |||||
| FU/LV | 86 (55.8) | 94 (50.5) | 128 (53.8) | 149 (47.6) | 29 (46.8) |
| IFL | 68 (44.2) | 92 (49.5) | 110 (46.2) | 164 (52.4) | 33 (53.2) |
| BMI, kg/m2, median (range)‡ | 27.6 (18-50) | 27.4 (16-46) | 27.3 (17-49) | 27.3 (16-52) | 27.5 (19-46) |
| Physical activity, MET-h/w, median (range)‡ | 4.7 (0-120) | 4.9 (0-147) | 3.5 (0-125) | 6.0 (0-114) | 8.9 (0-115) |
| Current smoker, No. (%)‡ | 10 (6.5) | 13 (7.0) | 18 (7.6) | 39 (12.5) | 14 (22.6) |
| Current use of multivitamin, No. (%)‡ | 78 (50.6) | 104 (55.9) | 122 (51.3) | 136 (43.5) | 29 (46.8) |
| Dietary intake, median (range)‡ | |||||
| Total energy, kcal/d | 1,937 (559-3,974) | 1,915 (650-3,902) | 1,805 (615-3,891) | 2,012 (618-4,100) | 2,224 (1,045-3,784) |
| Alcohol consumption, g/d | 0 (0-66.9) | 0.4 (0-54.7) | 0.4 (0-83.2) | 0.7 (0-93.0) | 1.0 (0-46.9) |
| Glycemic load | 151.9 (57.5-230.9) | 152.1 (88.9-231.1) | 148.5 (79.2-246.6) | 145.9 (80.1-211.4) | 138.2 (90.7-187.3) |
| Sugar-sweetened beverage, s/d | 0.4 (0-4.8) | 0.4 (0-5.4) | 0.3 (0-5.9) | 0.2 (0-5.1) | 0.3 (0-3.4) |
| Total caffeine, mg/d | 39 (0-543) | 54 (1-441) | 131 (2-886) | 287 (2-1,376) | 459 (0-975) |
| Western dietary pattern, No. ≥ median (%)‡ | 68 (44.2) | 79 (42.5) | 96 (40.3) | 186 (59.4) | 47 (75.8) |
| Prudent pattern diet, No. ≥ median (%)‡ | 70 (45.5) | 100 (53.8) | 130 (54.6) | 154 (49.2) | 23 (37.1) |
Abbreviations: BMI, body mass index; FU/LV, fluorouracil and leucovorin; IFL, irinotecan, fluorouracil, and leucovorin; MET-h/w, metabolic equivalent task hours per week; s, servings.
Baseline performance status (PS): PS 0 indicates fully active; PS 1, restricted in physically strenuous activity but ambulatory and able to perform light work; PS 2, ambulatory and capable of all self-care but unable to perform any work activities, up and approximately more than 50% of waking hours.
T1-2 indicates level of invasion through the bowel wall not beyond the muscle layer; T3-4, level of invasion through the bowel wall beyond the muscle layer.
As reported on questionnaire 1.
