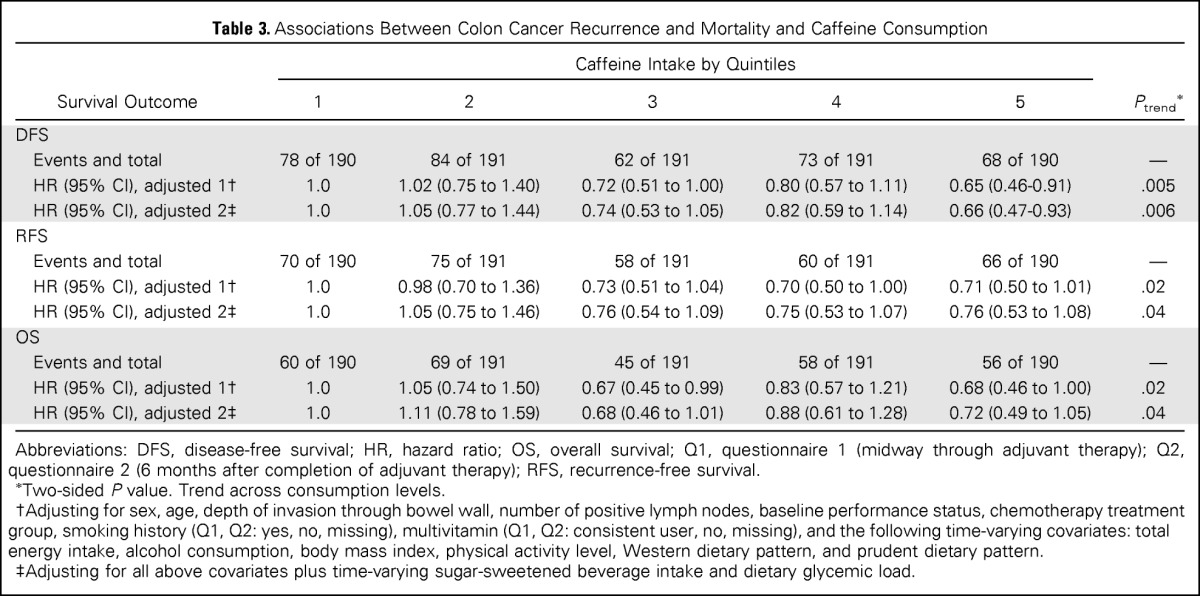
Table 3.
Associations Between Colon Cancer Recurrence and Mortality and Caffeine Consumption

| Survival Outcome | Caffeine Intake by Quintiles |
Ptrend* | ||||
|---|---|---|---|---|---|---|
| 1 | 2 | 3 | 4 | 5 | ||
| DFS | ||||||
| Events and total | 78 of 190 | 84 of 191 | 62 of 191 | 73 of 191 | 68 of 190 | — |
| HR (95% CI), adjusted 1† | 1.0 | 1.02 (0.75 to 1.40) | 0.72 (0.51 to 1.00) | 0.80 (0.57 to 1.11) | 0.65 (0.46-0.91) | .005 |
| HR (95% CI), adjusted 2‡ | 1.0 | 1.05 (0.77 to 1.44) | 0.74 (0.53 to 1.05) | 0.82 (0.59 to 1.14) | 0.66 (0.47-0.93) | .006 |
| RFS | ||||||
| Events and total | 70 of 190 | 75 of 191 | 58 of 191 | 60 of 191 | 66 of 190 | — |
| HR (95% CI), adjusted 1† | 1.0 | 0.98 (0.70 to 1.36) | 0.73 (0.51 to 1.04) | 0.70 (0.50 to 1.00) | 0.71 (0.50 to 1.01) | .02 |
| HR (95% CI), adjusted 2‡ | 1.0 | 1.05 (0.75 to 1.46) | 0.76 (0.54 to 1.09) | 0.75 (0.53 to 1.07) | 0.76 (0.53 to 1.08) | .04 |
| OS | ||||||
| Events and total | 60 of 190 | 69 of 191 | 45 of 191 | 58 of 191 | 56 of 190 | — |
| HR (95% CI), adjusted 1† | 1.0 | 1.05 (0.74 to 1.50) | 0.67 (0.45 to 0.99) | 0.83 (0.57 to 1.21) | 0.68 (0.46 to 1.00) | .02 |
| HR (95% CI), adjusted 2‡ | 1.0 | 1.11 (0.78 to 1.59) | 0.68 (0.46 to 1.01) | 0.88 (0.61 to 1.28) | 0.72 (0.49 to 1.05) | .04 |
Abbreviations: DFS, disease-free survival; HR, hazard ratio; OS, overall survival; Q1, questionnaire 1 (midway through adjuvant therapy); Q2, questionnaire 2 (6 months after completion of adjuvant therapy); RFS, recurrence-free survival.
Two-sided P value. Trend across consumption levels.
Adjusting for sex, age, depth of invasion through bowel wall, number of positive lymph nodes, baseline performance status, chemotherapy treatment group, smoking history (Q1, Q2: yes, no, missing), multivitamin (Q1, Q2: consistent user, no, missing), and the following time-varying covariates: total energy intake, alcohol consumption, body mass index, physical activity level, Western dietary pattern, and prudent dietary pattern.
Adjusting for all above covariates plus time-varying sugar-sweetened beverage intake and dietary glycemic load.
