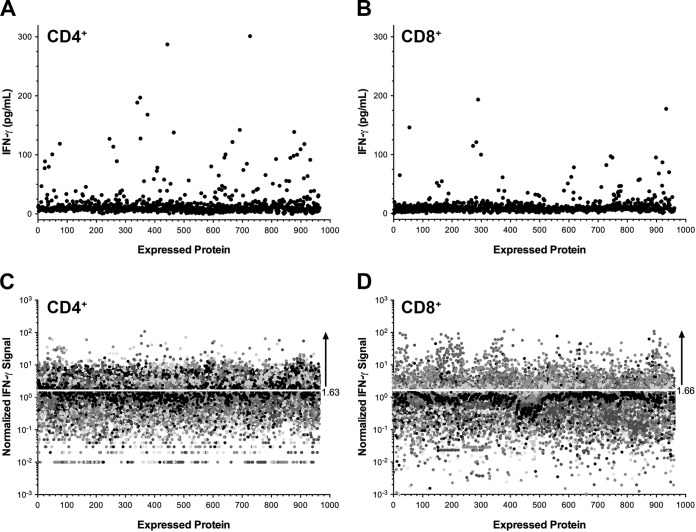
FIG 2.
T cell response profiling of study subjects against a C. trachomatis-expressed protein library. (A and B) Representative CD4+ (A) and CD8+ (B) T cell responses measured by IFN-γ ELISA against C. trachomatis proteome libraries expressed in E. coli and pulsed onto autologous MDDC. The average IFN-γ value in pg/ml for each clone in the library is represented by a single closed circle. (C and D) Aggregate CD4+ (C) and CD8+ (D) IFN-γ ELISA profiles for all study subjects were generated by log-normal transformation of the IFN-γ value and subsequent normalization of the IFN-γ value to the geometric mean response to an irrelevant antigen (GFP). The threshold used for the determination of positive IFN-γ responses is indicated by a white line at 1.63-fold (for CD4+) and 1.66-fold (for CD8+) signal ratios.

