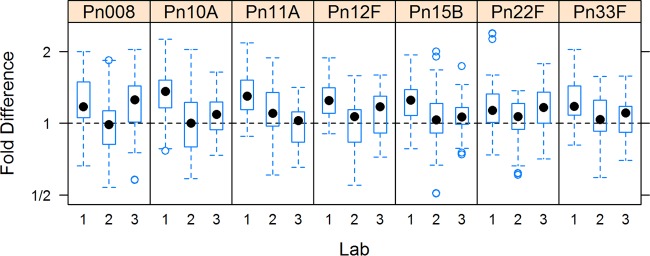
FIG 4.

Box plots illustrating the deviation of the 007sp estimates from those obtained by using 89SF for the seven serotypes of the panel of 12 WHO QC serum samples analyzed (n = ≥10 for each QC serum from each laboratory, total n = ≥120). In these plots, the box is defined by the 25th and 75th percentiles of the distribution; the dot within the box represents the median or 50th percentile. Vertical lines extend to the most extreme observation that is less than 1.5 times the interquartile range (75th to 25th percentiles), empty circles correspond to individual assay values that are progressively distant from the bulk of the data. Data above the dotted horizontal line indicate that 007sp estimates are greater than the estimates made with 89SF as the reference standard. On the vertical axis, 2 indicates a point where the 007sp estimate was twice the 89SF estimate. A value of 1/2 indicates that the 89SF estimate was two times the 007sp estimate. Boxes centered on the horizontal dotted line indicate good agreement between the 007sp and 89SF estimates.
