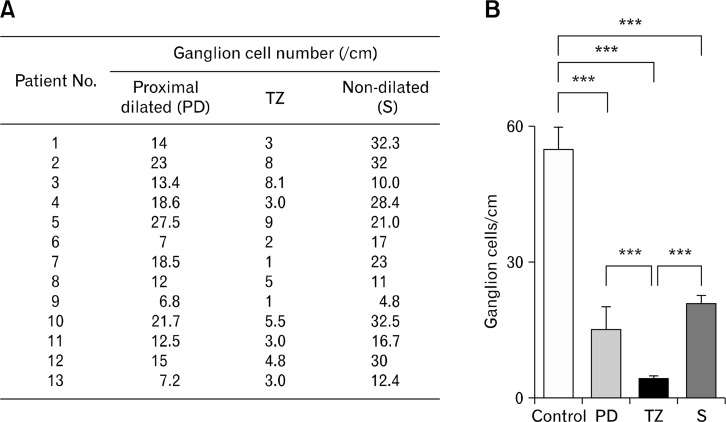
Figure 6.
Distribution of ganglion cell. (A) Number of ganglion cells counted in different regions of each colonic pseudo-obstruction colon. (B) Summary of the results shown in (A). The transition zone (TZ) retained significantly fewer gang-lion cells relative to the control and other areas in the vicinity. PD, proximal dilation; S, non-dilated sigmoid colon. ***P < 0.001.

