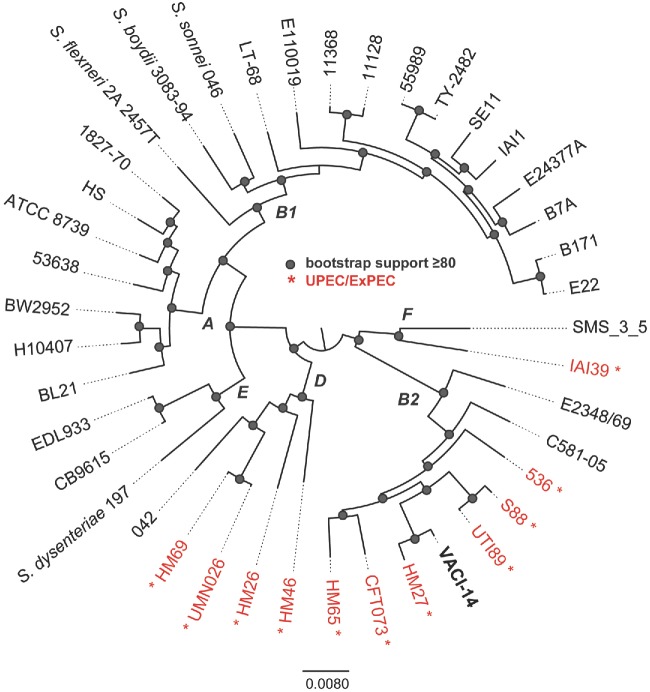
Figure 1.
Phylogenomic analysis of 41 E. coli and Shigella genomes that represent members of each of the sequenced pathotypes and phylogenetic groups. All genomes were aligned using Mugsy (Angiuoli and Salzberg 2011) and homologous blocks were concatenated as previously described (Hazen et al. 2013). A phylogenetic tree was inferred with RAxML v7.2.8 (Stamatakis 2006) on this alignment, with 100 bootstrap replicates and nodes that have bootstrap support ≥80 are indicated by a shaded circle. Letters at nodes indicate the E. coli phylogroup as previously defined by MLST or phylogenomic analyses. Isolates indicated in red are from urinary tract sources of isolation.

