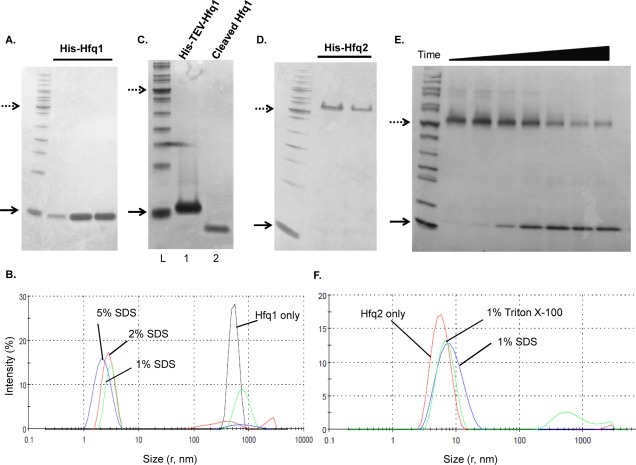
Figure 3.
Purification and characterization of Hfq1 and Hfq2. Dotted (50 kDa) and solid (10 kDa) arrows mark protein ladder reference bands; samples are run as semi-native unless indicated. (A) Monomeric appearance of His-Hfq1; fractions from nickel column on 16% Tricine. (B) DLS of His-Hfq1 samples, incubated overnight at room temperature. Black curve—no additives; Green curve—1% SDS; Red curve—2% SDS; Blue curve—5% SDS. (C) Monomeric appearance of His-TEV-Hfq1 and Hfq1; 16% Tricine. Lane 1, uncleaved protein; Lane 2, cleaved and purified protein. (D) Hexameric appearance of His-Hfq2; 4%–20% Tris–Glycine. (E) Appearance and dissociation of His-TEV-Hfq2 hexamers, with increasing boiling time before loading to 4%–20% Tris–Glycine. From left, boiling times were 0″, 30″, 1′, 2′, 4′, 8′, and 12′. (F) DLS of His-TEV-Hfq2, performed in Glycerol Buffer (Supporting Information) + 400 mM imidazole post-elution from nickel. Results are the average of two independent accumulations at 25°C and are displayed here under the standard viscosity setting; RH values in Results are corrected for the theoretical effect of the 5% glycerol on solution viscosity.

