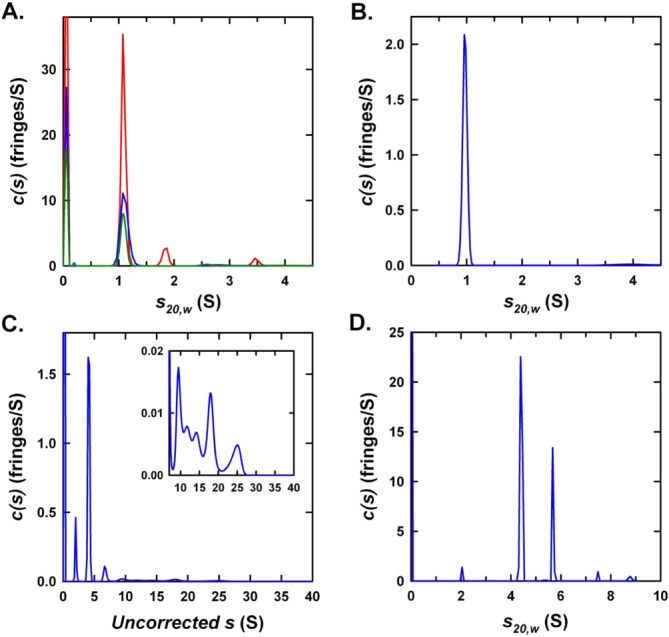
Figure 4.

Analytical ultracentrifugation of Hfq1 and Hfq2. Rayleigh interference c(s) distributions for (A) His-Hfq1 at 120 (red), 60 (blue), and 30 µM (green) in 500 mM NaCl and 20 mM Tris–HCl (pH 7.4); (B) Hfq1 at 8.3 µM in 500 mM NaCl and 50 mM Tris–HCl (pH 7.4); (C) His-Hfq2 in 500 mM NaCl and 20 mM Tris–HCl (pH 7.4); and (D) His-TEV-Hfq2 at 125 µM in 1M NaCl, 50 mM Tris–HCl (pH 7.4) and 5% (v/v) glycerol. Inset in (C) expands intensity scale for the faster sedimenting species, which have disproportionate absorbance contributions. Data for (A) show a major species at 1.09S with estimated molar mass of 9.8 kDa, indicative of a His-Hfq1 monomer (expected monomer mass = 8797 Da). Data for (B) show a single species at 0.96S with estimated molar mass of 7.5 kDa (expected monomer mass = 7325 Da).
