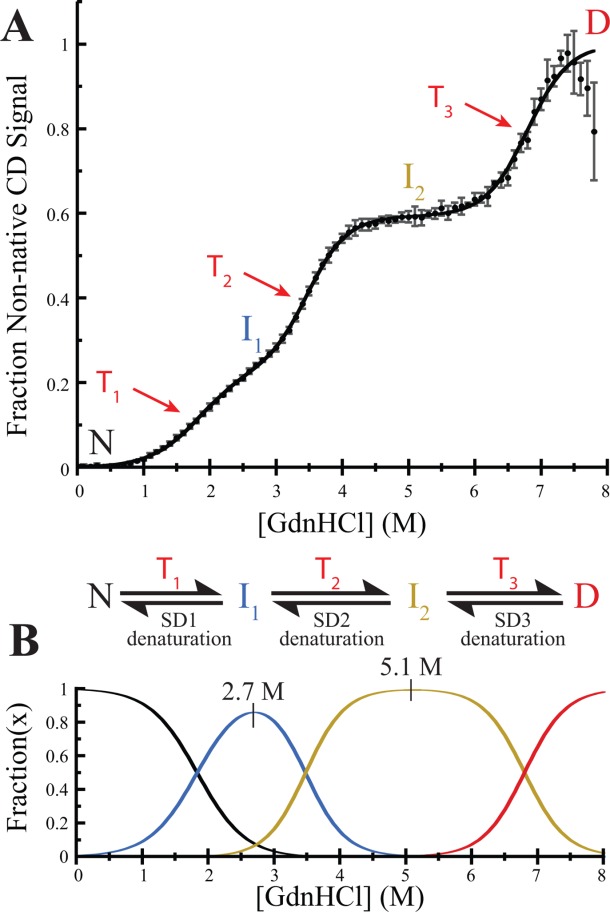
Figure 3.

HpmA265 TPS domain unfolding and sequential unfolding model. A) Replicate denaturation profiles presented as average ± standard deviation of three experiments. Native (N), first intermediate (I1), second intermediate (I2), and denatured state (D) are indicated with colors corresponding to panel (B), the transitions between these states (T1, T2, T3) are indicated with red arrows. Transitions 1, 2, and 3 correspond to the denaturation of SD1, SD2, and SD3, respectively. Trend line calculated from average values of the fit parameters as presented in Table I. B) Scheme for sequential unfolding model and fraction of N, I1, I2, and D over a range of GdnHCl concentrations. The approximate GdnHCl concentration necessary to give maximum population of each of the intermediates is indicated above the peak.
