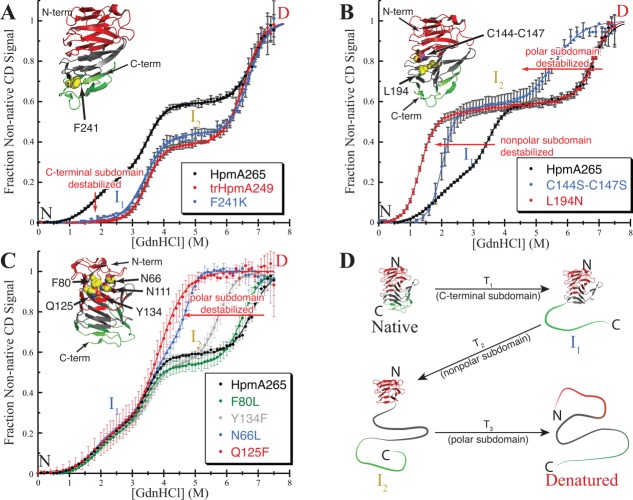
Figure 5.
GdnHCl titrations of mutants and resulting sequential model for HpmA265 unfolding. Titration data and trend lines are presented as in Figure 3 with HpmA265 data provided in black in each panel. The effect of each mutation on HpmA265 are noted by a red arrow for each group of mutations. Cartoon insets show site-specifically mutated residues rendered as spheres and colored by atom type. (A) Constructs targeting the C-terminal subdomain resulting in elimination of the N → I1 transition (T1). (B) Constructs targeting the nonpolar subdomain resulting in a shift of the I1 → I2 transition (T2). (C) Representative constructs targeting the polar subdomain resulting in a shift of the I2 → D transition (T3). (D) Sequential unfolding model for HpmA265. The subdomain that is unfolded during each transition is named below the arrow.

