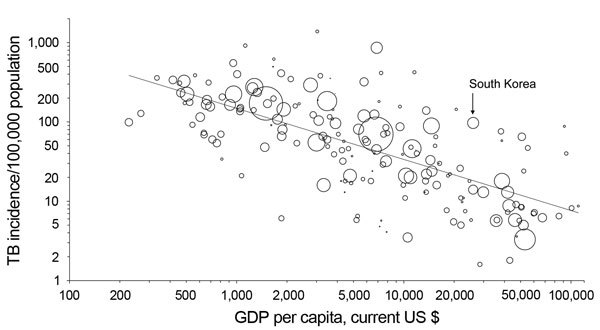
Figure 2.

Relationship between per capita gross domestic product (GDP) and incidence of tuberculosis (TB), 2013. Each dot represents 1 country; South Korea is indicated. The third root of the population was used to determine the size of the circles, and the figure is drawn on a logarithmic scale. The line indicates the regression on the logarithm. The figure was adapted from (19) with permission from The European Respiratory Society. Updated data was derived from (1).
