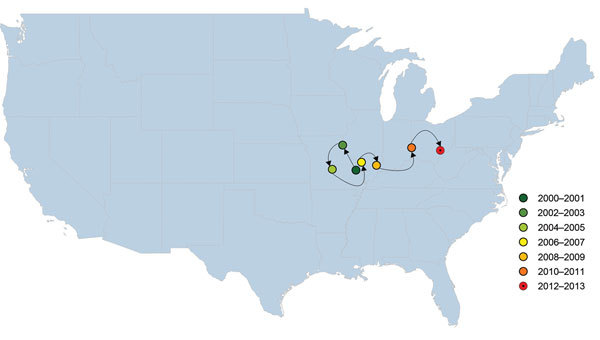
Figure 4.

Weighted mean geographic center for proportions of methicillin-resistant Staphylococcus aureus (MRSA) USA300 strain type, United States, 2000–2013. This map shows the likely trend in the spread of USA300 as a proportion of all MRSA isolates that underwent genotyping, but the trajectory could be biased by large studies or lack of studies in certain states in specific years. The final mean center for 2012–2013 is represented differently to indicate that it is based on a small number of isolates.
