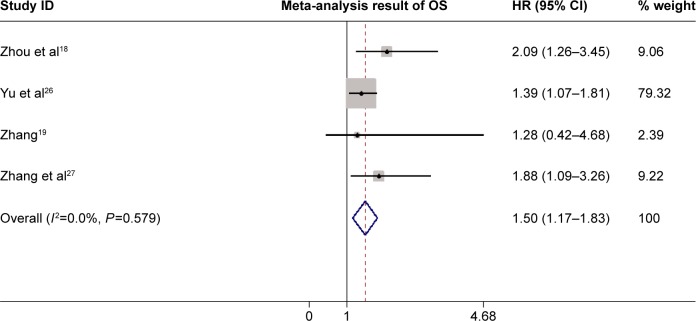
Figure 2.
Forest plot of HR for OS of patients with HCC.
Notes: The squares and horizontal lines represent HR and 95% CI. The diamonds represent the pooled HR and 95% CI. The solid vertical line is at the null value.
Abbreviations: HR, hazard ratio; OS, overall survival; HCC, hepatocellular carcinoma; CI, confidence interval.

