Figure 1.
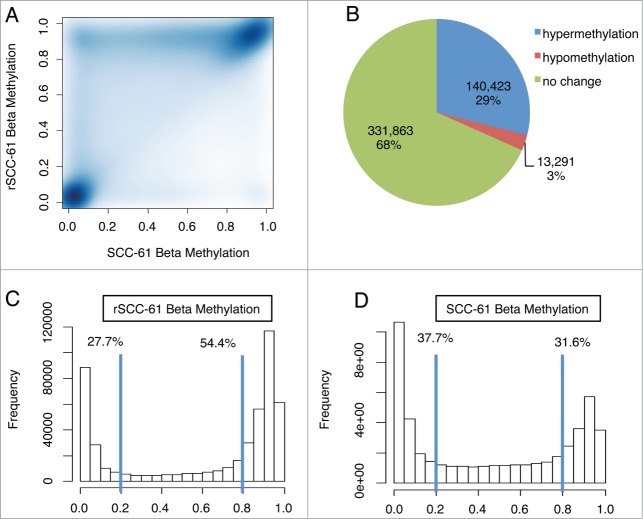
Radiation resistance is accompanied by a significant increase in DNA methylation. (A) Scatter plot of β methylation comparing rSCC-61 and SCC-61. Differentially methylated CpG sites in rSCC-61 are primarily hypermethylated, as shown by the data above the diagonal. (B) Pie chart of the methylation change of all CpG sites in rSCC-61 compared with SCC-61. Approximately 10 times more CpG sites are hypermethylated in rSCC-61 in comparison to SCC-61 cells (140,423 vs. 13,291). (C, D) Beta value distribution of rSCC-61 (C) and SCC-61 (D). While over half of the CpG sites in rSCC-61 have β values greater than 0.8, only 31.6% of CpG sites in SCC-61 have β values greater than 0.8. To see this figure in color, please refer to the online version of this article.

