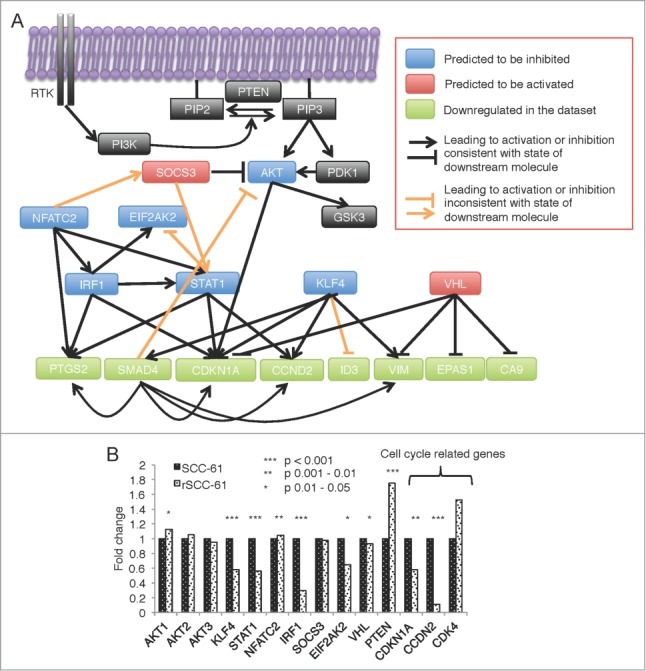
Figure 5.

IPA predicted upstream regulator network for differentially methylated and expressed genes in rSCC-61 cells. (A) The complete network obtained from performing the Regulator Effects analysis of the differentially methylated and expressed genes is shown in Figure S2 in Supplemental File 3. The AKT-connected subnetwork was extracted and enriched with other relevant components of the AKT pathway (black boxes). From bottom up in this panel, the molecules in light green are a subset of genes with downregulated gene expression. Based on these findings, the molecules shown in blue boxes are predicted by the Regulator Effects analysis to be inhibited, and molecules shown in red are predicted to be activated. Black lines represent relationship effects (activating or inhibitory) consistent between our experimental data and IPA literature knowledge, and orange lines represent findings inconsistent with state of downstream molecule. (B) mRNA expression levels of the predicted genes and cell cycle-related genes extracted from the HumanHT-12 v4 Expression BeadChip data. Asterisks indicate statistically significant changes in gene expression in rSCC-61 relative to SCC-61 cells [α = 0.05, P-values of 0.01–0.05 (*), 0.001–0.01 (**), or <0.001 (***)].
