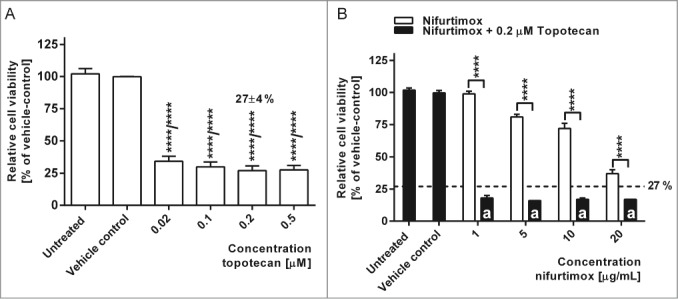
Figure 2.

Cell viability after nifurtimox and/or topotecan treatment. (A) Data show cell viability of cell line LS (N-Myc amplified) in reference to vehicle control after 48h incubation with topotecan as indicated, growth medium alone (untreated) or vehicle control tested with a MTS cell viability assay. Sample size n = 4. Data show mean ± standard deviation. Significant changes vs. vehicle control tested via ANOVA indicate P < 0.0001 (****). (B) Data show cell viability of cell line LS (N-Myc amplified) in reference to vehicle control after 48h incubation with nifurtimox as indicated or nifurtimox + 0.2 µM topotecan tested with a MTS cell viability assay. Sample size n = 4. Dotted line indicates cell viability after 48h incubation with 0.2 µM topotecan alone. Significant differences were tested with an ANOVA and Sidak-Bonferroni correction for multiple comparison (****: P < 0.0001); “a” indicates significant difference to treatment group 0.2 µM topotecan alone.
