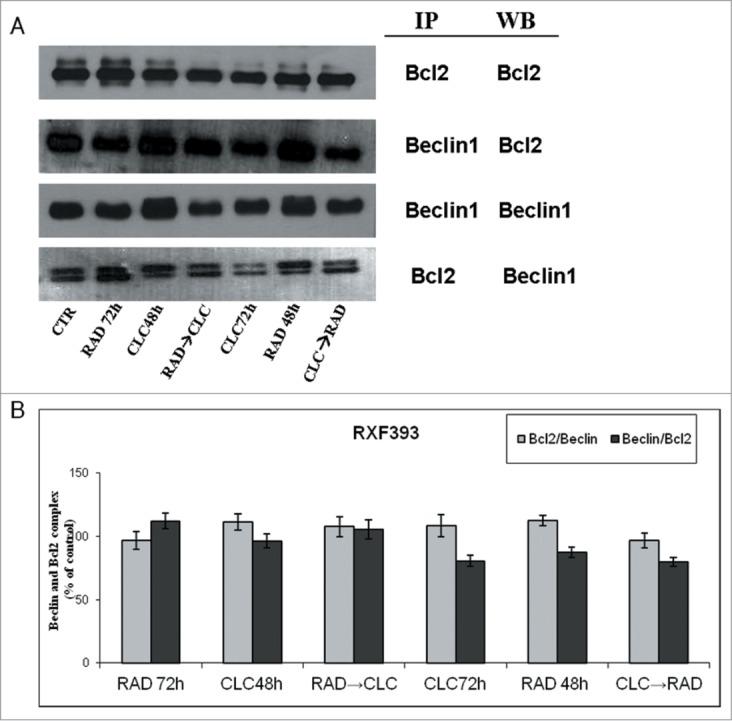
Figure 5.

Evaluation of Beclin-1 and Bcl-2 interaction. (A) RXF393 were treated with CLC and RAD alone or in sequence. Then we performed western blotting assay (WB) for the expression of the total Bcl-2 and Beclin-1 proteins and immunoprecipitation (IP) for the evaluation of Bcl-2/Beclin-1 and Beclin-1/Bcl-2 complex formation. (B) Representation of the complexes expressed as the ratio between the relative intensities of the bands associated with the Bcl-2/Beclin-1 and Beclin-1/Bcl-2 complexes vs. the bands associated with total Bcl-2 and Beclin-1, respectively. The intensities of the bands were expressed as arbitrary units when compared to those of the untreated cells (CTR) The figure is representative of 3 different experiments that always gave similar results.
